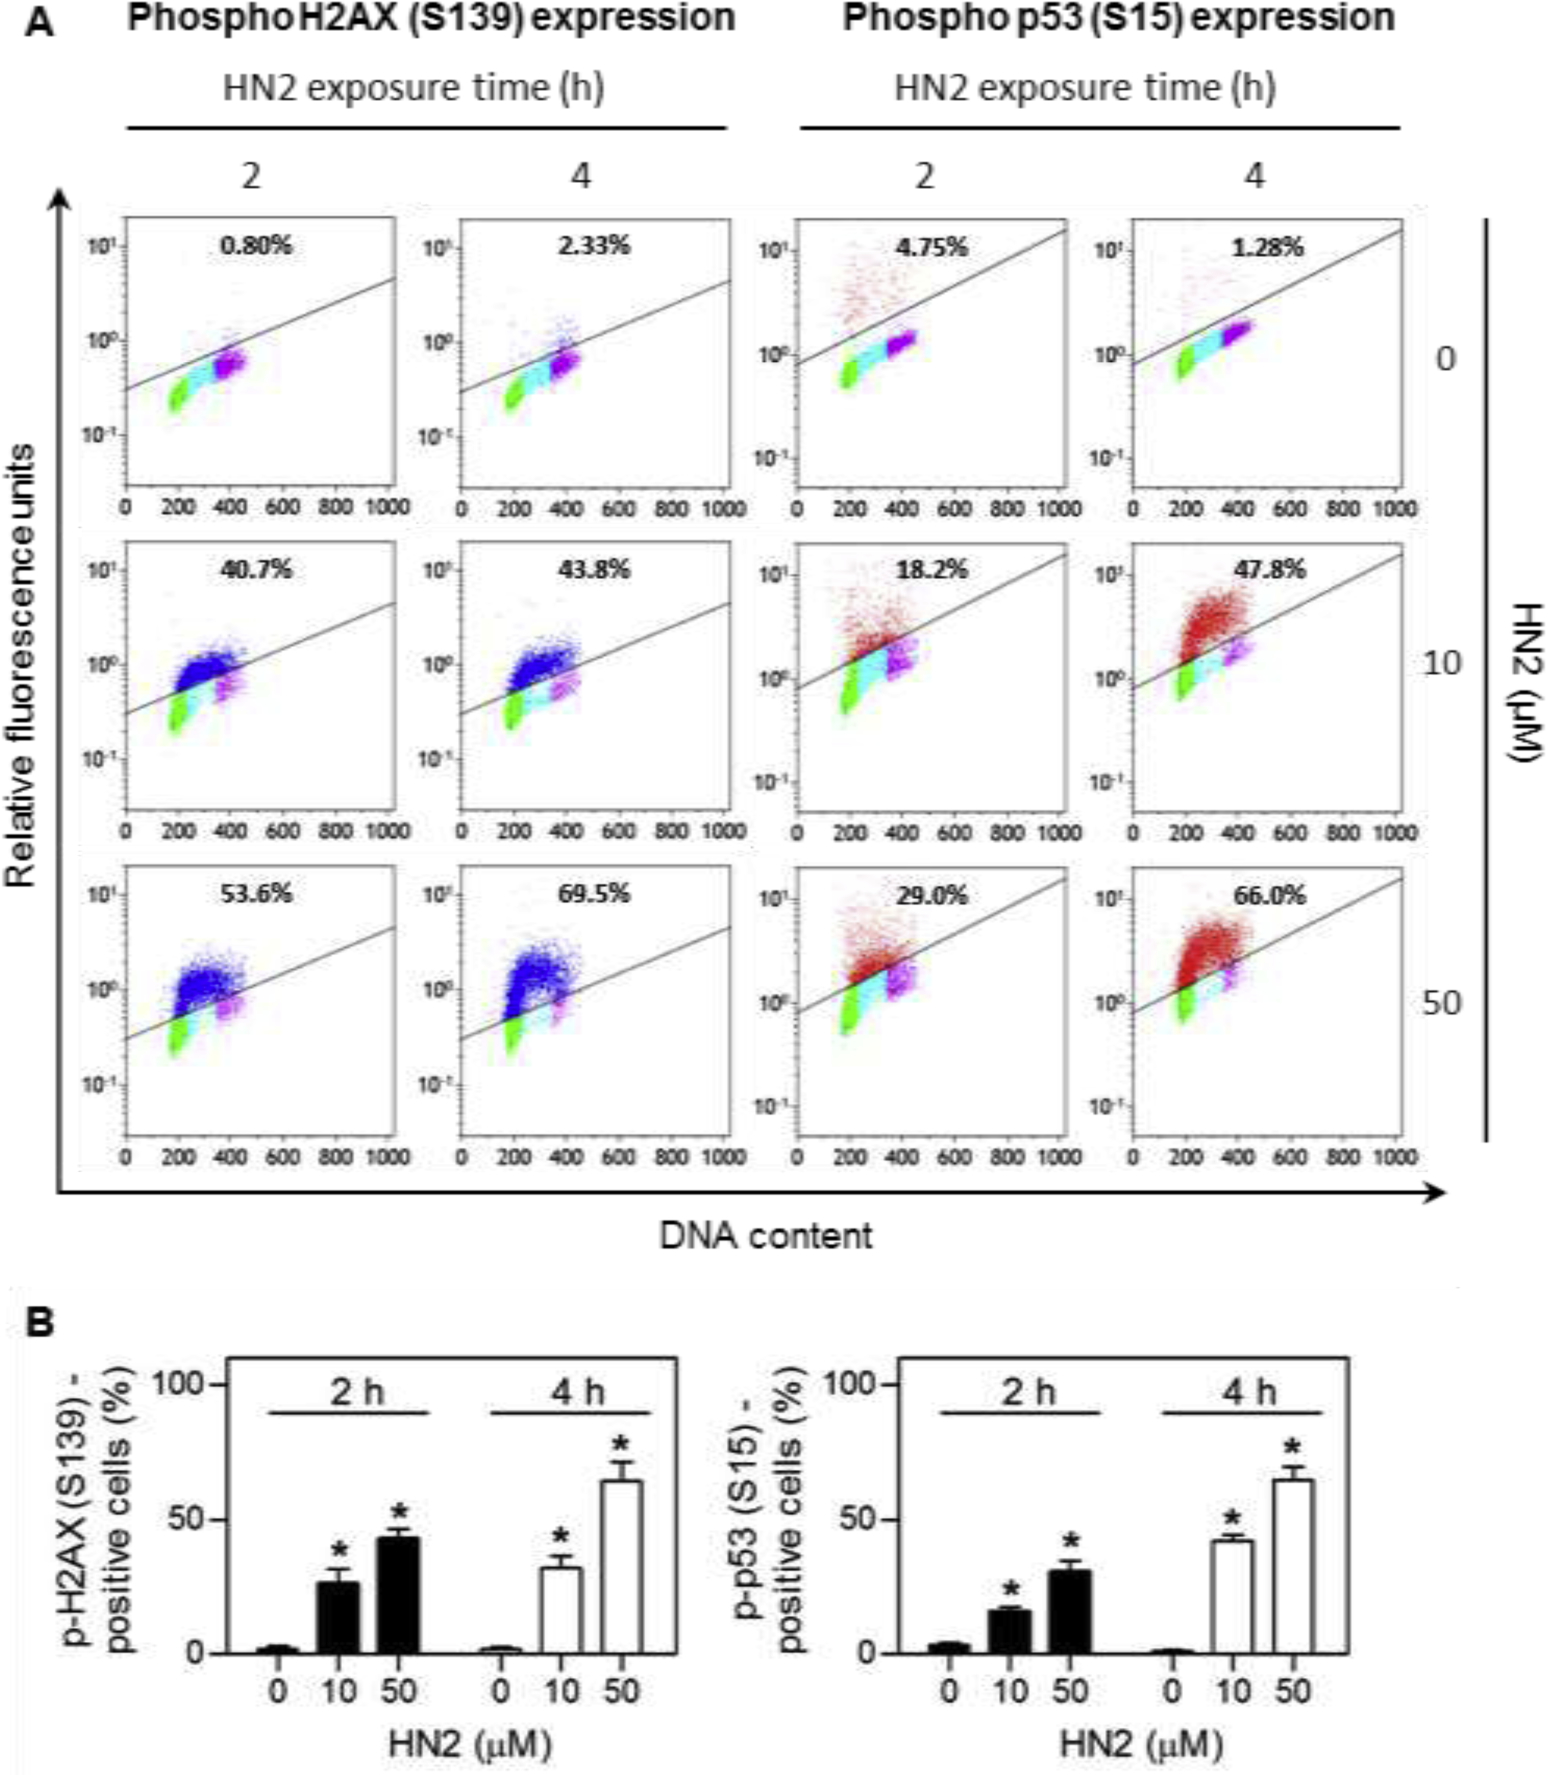
Fig. 2. Cell cycle-dependent induction of DNA damage response proteins by HN2 in A549 cells.

A549 cells were treated with increasing concentrations of HN2 or vehicle control in serum-free medium. After 2 h and 4 h, cells were harvested and stained with Alexa Fluor 488-conjugated phospho H2AX (S139) antibody or Alexa Fluor 647-conjugated phospho p53 (S15) antibody. DNA was then stained with propidium iodide and the cells analyzed by flow cytometry. (A) Representative bivariate distributions of DNA and expression of phospho proteins. Cells shown in blue express phospho H2AX (S139), while cells in red express phospho p53 (S15). Cells that do not express or express very low levels of phospho H2AX or phospho p53 are shown in green for cells in G0/G1 phase, cyan for cells in S phase, and magenta for cells in G2/M phase. The percentages of immunopositive cells are shown at the top of each panel. (B) Relative phospho H2AX and phospho p53 protein expression. Data are presented as means ± SE, n = 4. Data adapted from Jan et al., 2019.
