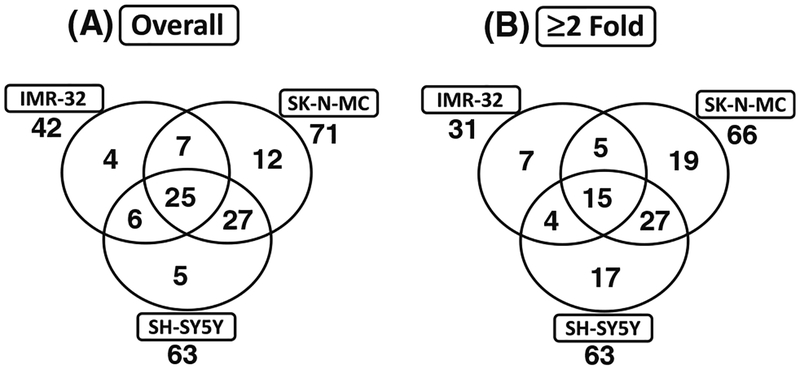
Fig. 1.
Venn diagrams showing the number of tumor invasion and metastasis molecules significantly upregulated (a) without or (b) with stringent criteria (≥twofold) in human neuroblastoma (IMR-32, SKN-MC and SH-SY5Y) cells exposed to radiation (2 Gy). The numbers outside each circle represent the total number of genes upregulated in each cell-line. The numbers inside the greater part of the circles represent the genes that were selectively upregulated in that particular cell-line. The numbers in two overlapping circles represent the number of genes upregulated commonly in two cell lines. The numbers in the center represent genes upregulated in all three cell lines

