. 2020 Apr 20;9:e54304. doi: 10.7554/eLife.54304

Figure 3. Wild-type WNT signaling progenitor cells express high levels of WNT inhibitors.

(A) Strategy used to isolate and profile slow-cycling basal progenitors from the epidermal fraction of dispase-treated, wild-type E17.5 skin, which contains epidermis and early hair placodes/buds. Note: LEF+ progenitors are simultaneously LHX2GFP+ and mKO2+. (B) Volcano plot and comparative expression profiling reveals that relative to their epidermal counterparts, wild-type basal placode/bud progenitors share strong signature similarities with Apc-null progenitors. Green dots denote previously reported WNT target genes. (C) In situ hybridizations showing that WNT signaling progenitor cells simultaneously express mRNAs for WNT activators and WNT inhibitors. Black dashed lines, epidermal-dermal boundary; white dashed lines demarcate the dermal condensate (DC). Scale bars, 10 μm.

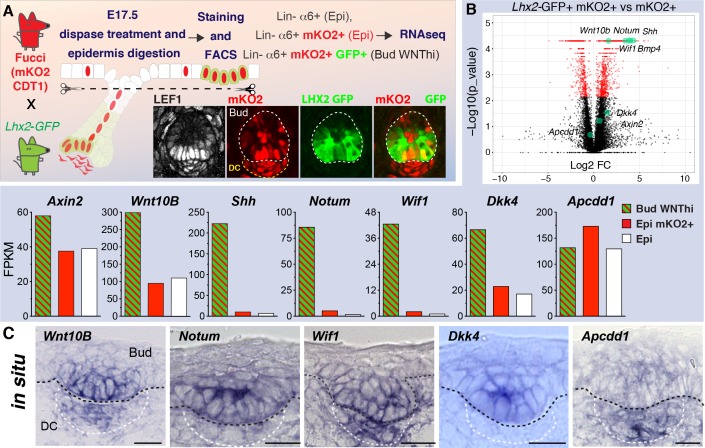
Figure 3—source data 1. Source data for the graphs shown in Figure 3B.

Figure 3.

Figure 3—figure supplement 1. FACS purification strategy to isolate WNThi placode and WNTlo epidermal progenitors from wild-type embryonic skin.

Figure 3—figure supplement 1.

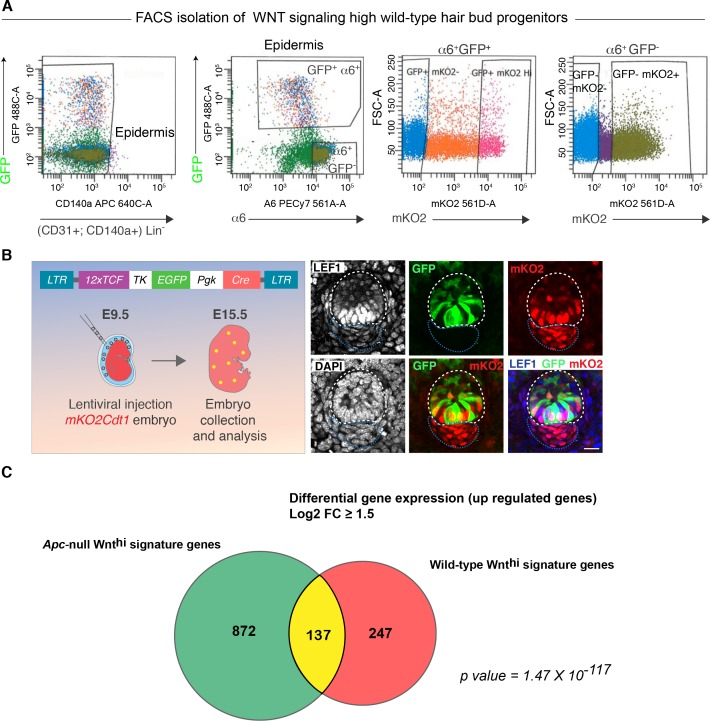
(A) FACS purification plots of single cell suspensions isolated from the dispase-selected epidermal/hair bud fraction of E17.5 skin. Pups were transgenic for Lhx2-GFP, active in basal hair bud progenitors, and for mKO2Cdt1, active in the slow-cycling basal skin progenitors of both hair buds and interfollicular epidermis. All basal progenitors are marked by α6 integrin. Non-epidermal cells (Lin-: CD131+ and CD140a+) were excluded by FACS. (B) mKO2Cdt1 embryos were exposed to lentivirus at E9.5 and analyzed at E15.5 as depicted in the schematic. The LV harbored a WNT-GFP reporter (12xTCF-TK-EGFP) and Pgk-Cre. Note that the progenitor cells from the developing hair follicle are concomitantly LEF1+, mKO2+ and WNT reporter positive. Scale bar, 20 μm. (C) Venn diagram depicts the overlap between Apc-null WNThi signature genes and wild-type (Lhx2GFP+ mKO2Cdt1+) WNThi signature genes. P values were calculated using the hyper geometric distribution formula via R. Note: While overlap was appreciable, WNThiApc-null transcripts were pure placode signature genes and in addition encoded cell cycle inhibitors, while wild-type WNThi cells included not only placode but also some bud mRNAs, and although slow-cycling, these cells were still proliferative.
Figure 3—figure supplement 2. WNThi signature genes in hair follicle development.

Figure 3—figure supplement 2.

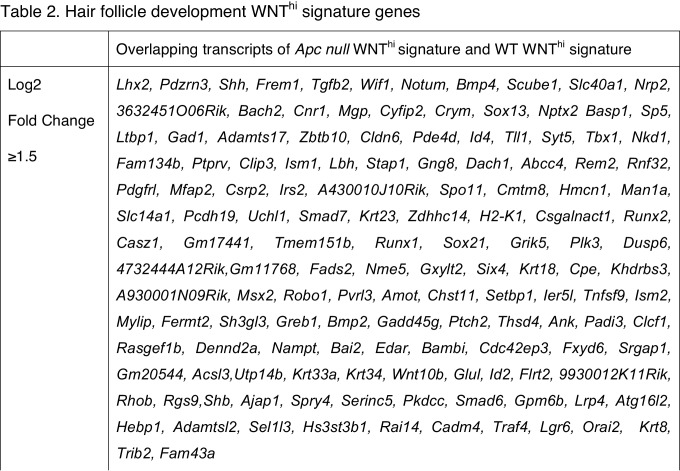
Shown is a list of transcripts that are shared between the Apc null WNThi signature and the wild-type WNThi signature.
Figure 3—figure supplement 2—source data 1. WNThi signature genes in hair follicle development.
Shown is a list of transcripts that are shared between the Apc null WNThi signature and the wild-type WNThi signature.
Figure 3—figure supplement 3. BMP4 acts long range to perturb hair follicle patterning.

Figure 3—figure supplement 3.

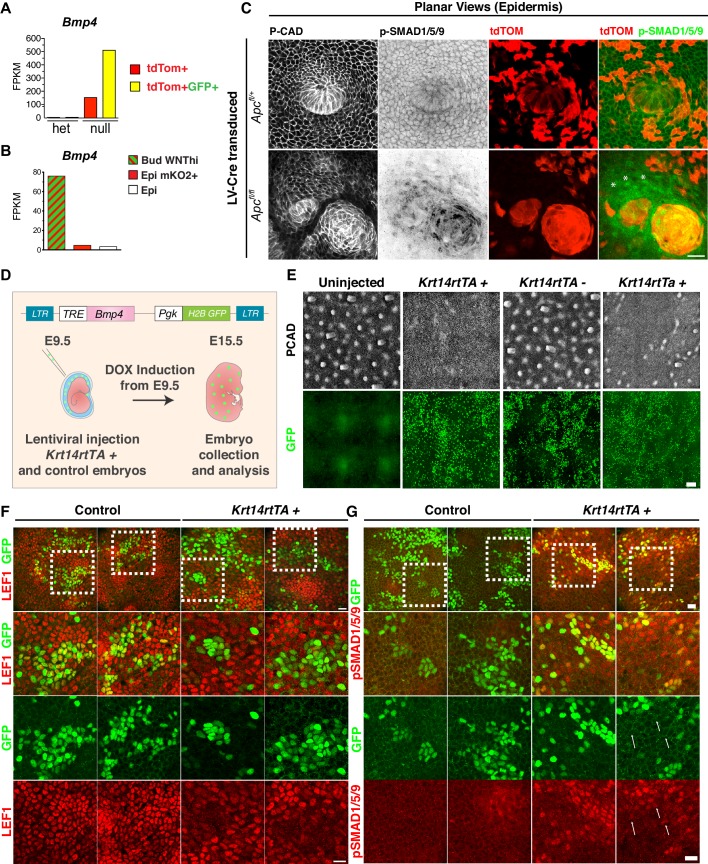
(A–B) Strong correlation between WNT signaling and Bmp4 levels in both (A) Apc-null clusters and (B) wild-type hair buds. (C) Whole-mount immunofluorescence of E14.5 mosaic Apc-null and Apc-het embryos. Note a halo (asterisks) of nuclear pSMAD1/5/9+ cells extending well beyond the borders of Apc-null clusters, indicative of long-range BMP signaling. Scale bar, 20 μm. (D) Experimental setup to overexpress BMP4 in skin progenitors. BMP4 is under the regulation of a tetracycline regulatory enhancer (TRE) activated by doxy-induced rtTA transcription factor binding. The lentivirus was introduced at E9.5 into the amniotic cavity of Krt14rtTA+ and Krt14rtTAneg embryos, which were then analyzed at E15.5. (E) Whole-mount images of 1 mm2 E15.5 skins of Doxy-treated Krt14rtTA+ and control (Krt14rtTAneg) littermates. Note the perturbation in patterning of hair follicles (P-Cadherin+). Scale bar, 100 μm. (F–G) Representative regions of transduced and untransduced epidermis in Krt14rtTA negative and positive littermates, (F) Note the reduced LEF1 immunostaining in GFP+ BMPhi-signaling cells. (G) Note the presence of nuclear pSMAD1/5/9 positive cells distant from the BMPhi-signaling cells (white arrows), suggestive of long-range signaling. White boxes delineate the regions that are magnified in the three images beneath each low-magnification panel. Scale bar, 20 μm.
Figure 3—figure supplement 3—source data 1. Source data for the graphs shown in Figure 3—figure supplement 3A and B.
Figure 3—figure supplement 4. Apc-null cells express high levels of WNT inhibitors.

Figure 3—figure supplement 4.

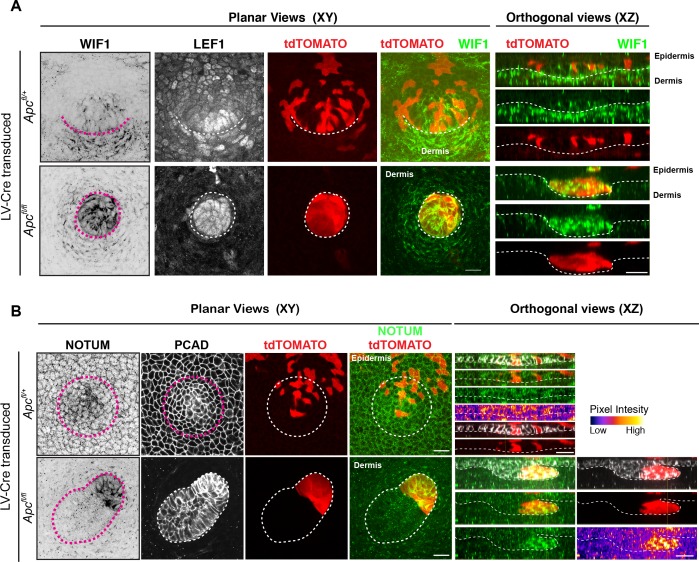
(A–B) Representative immunofluorescence images and respective orthogonal views from Apc-null and Apc-het transduced tdTomato+ embryonic skins showing endogenous (A) WIF1 and (B) NOTUM patterns. Note strong expression of WNT inhibitors NOTUM and WIF1 in Apc-null clusters, despite presence of nuclear LEF1 and robust WNT signaling. Circular dashed line in Apc-het outlines a placode. Dotted lines demarcate epithelial-mesenchymal boundaries. The XY axis is planar to the epidermis; the XZ axis shows sagittal views perpendicular to the skin surface. Scale bars, 20 μm.