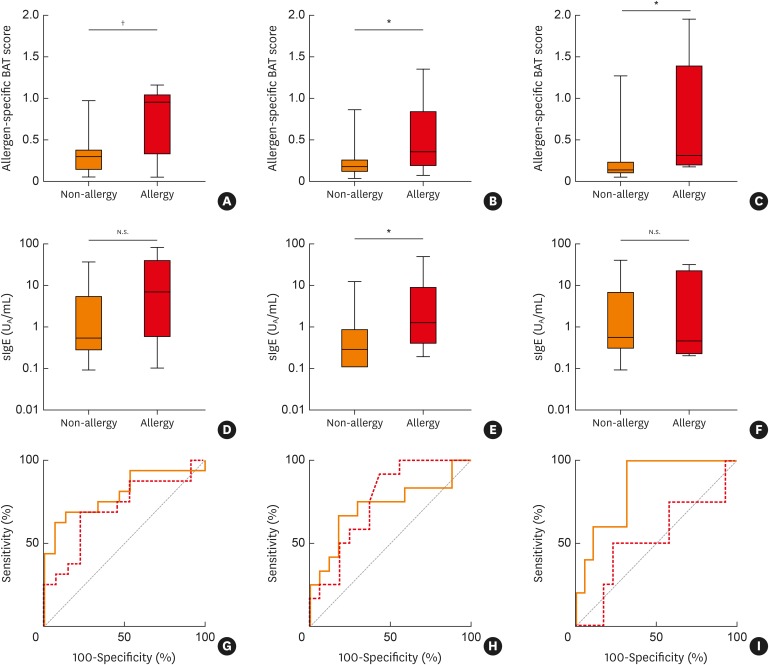
Fig. 1. Allergen-specific BAT scores in patients allergic/non-allergic to (A) salmon, (B) mackerel and (C) tuna. Specific IgE levels in patients allergic-/non-allergic to (D) salmon, (E) mackerel and (F) tuna. ROC curves of BAT (solid line) and sIgE (dotted line) for (G) salmon, (H) mackerel and (I) tuna are shown. The areas under the ROC curve were 0.80, 0.72 and 0.84 for the BAT score and 0.73, 0.75 and 0.51 for sIgE.
BAT, basophil activation test; sIgE, specific IgE; ROC, receiver-operating-characteristic.
*P < 0.05; †P < 0.005.

