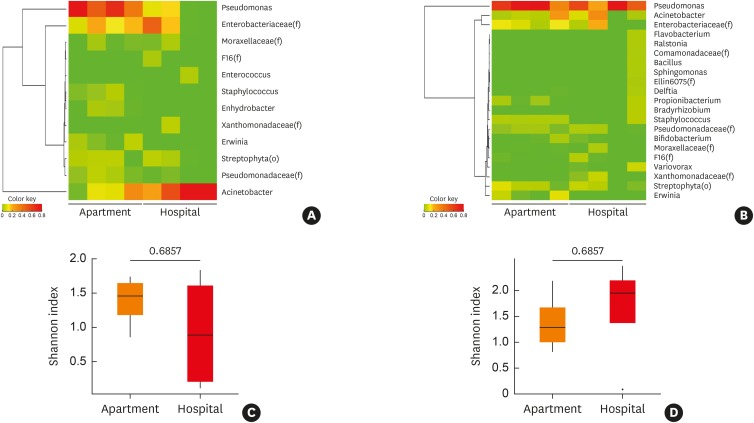
Fig. 1. Comparison of the microbiome composition and diversity of indoor dust in the apartment and hospital. Taxa that were over 1% in any samples selected for heatmap and Shannon index were analyzed for alpha diversity. Heatmap for microbiome abundance of (A) microbiota in indoor dust at the genus level, (B) heatmap for microbiome abundance of microbial EVs in indoor dust, at the genus level, (C) Shannon index for alpha diversity of microbiota in indoor dust, (D) Shannon index for alpha diversity of microbial EVs in indoor dust.
EV, extracellular vesicle.
*The value outside range mean ± 3standard deviation.

