
FIG. 1. Compressive stress versus compressive strain for wild-type mouse embryo fibroblast cells.
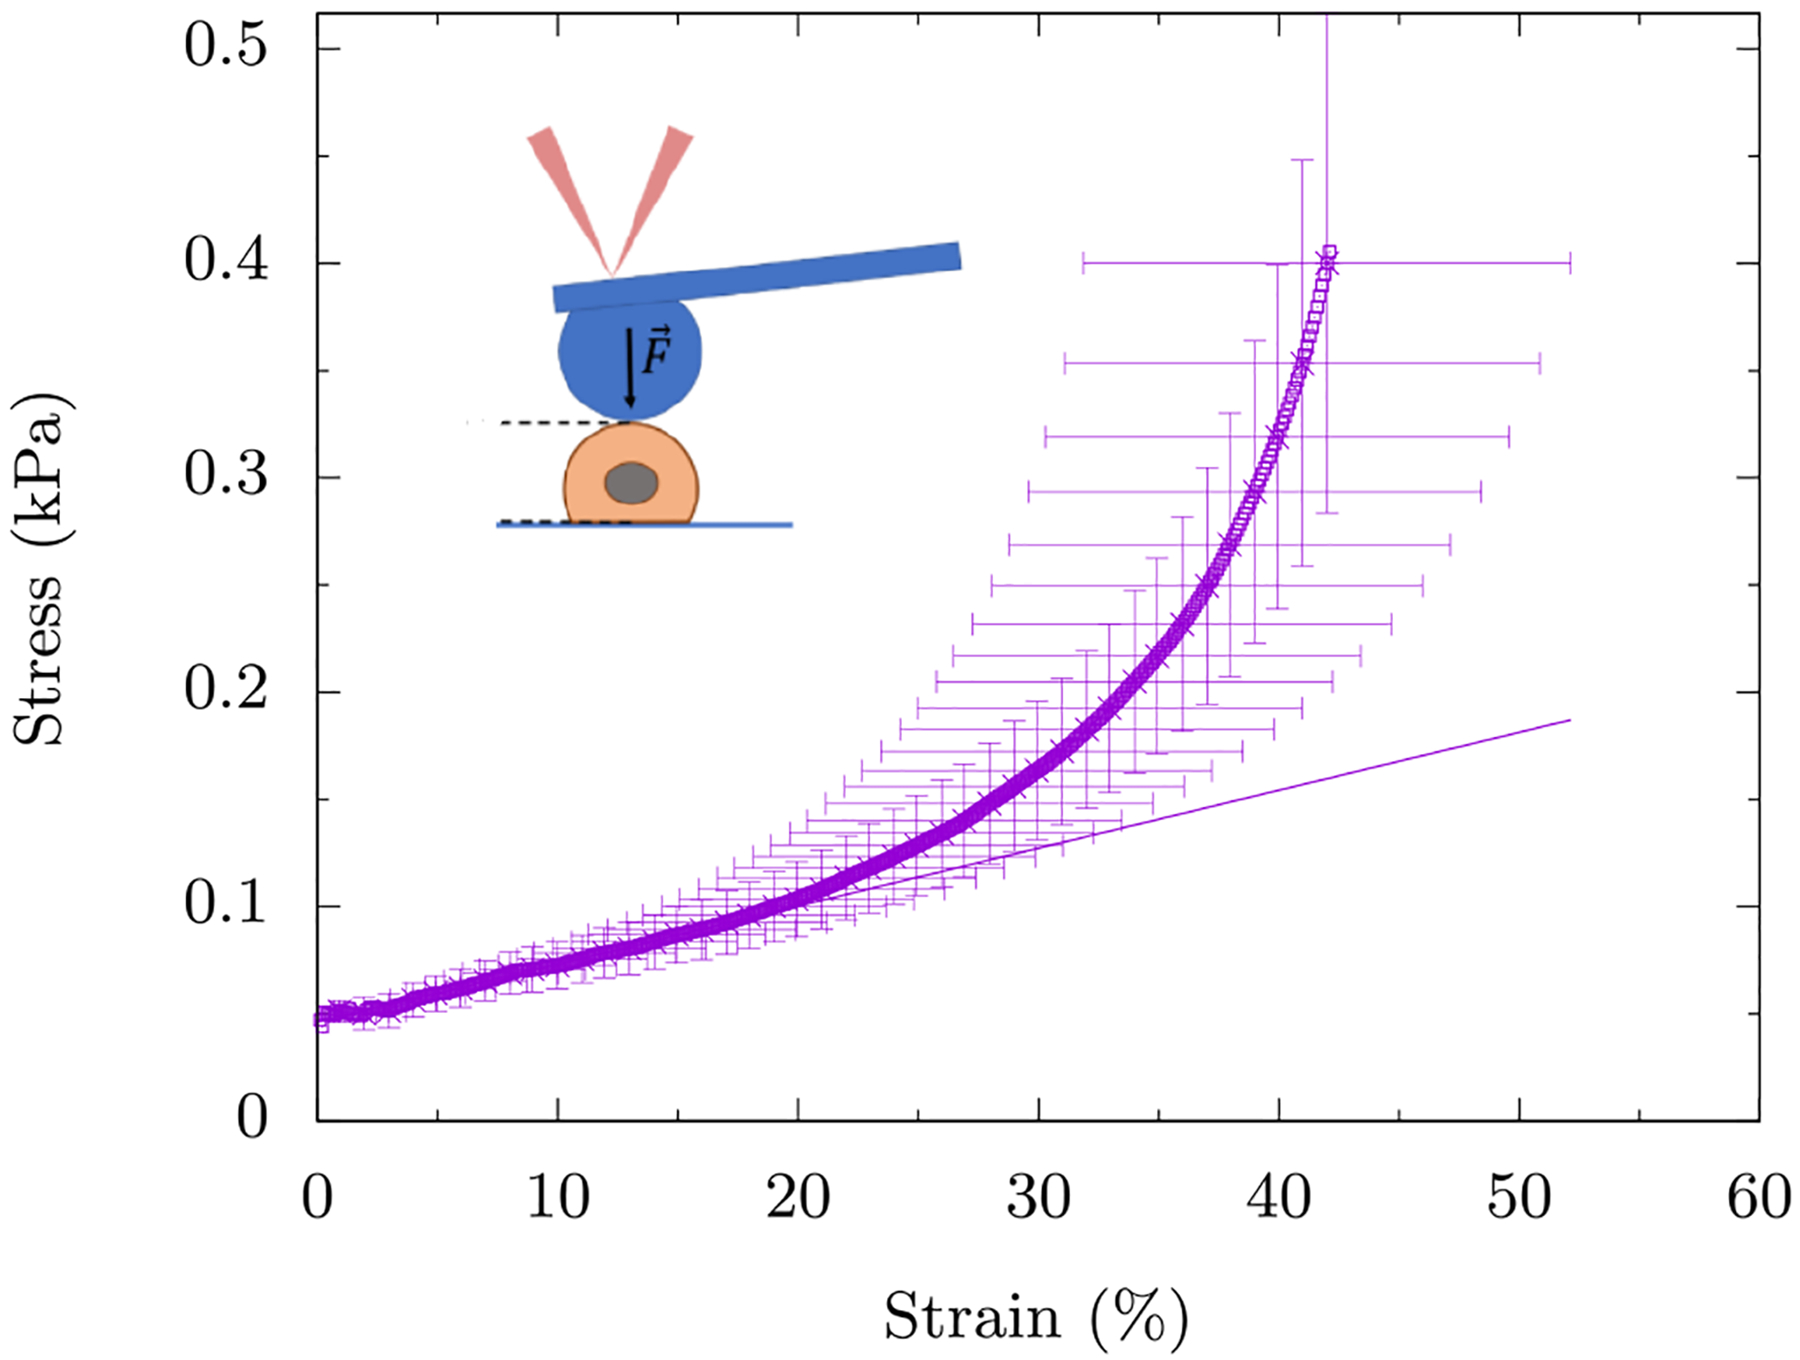
The symbols represent the data and the line represents a linear fit to the data for up to 20% strain. We observe the onset of compression stiffening around γc ≈ 20%. The inset is a schematic of the experiment where the AFM tip is attached to a glass bead (blue) which in turn applies a global strain on the mEF cell (salmon). The data is averaged over ten mEF cells with the error bars denoting the standard deviation.