
FIG. 9. A cell as a viscous interior surrounded by an actomyosin cortex with a soft area constraint.
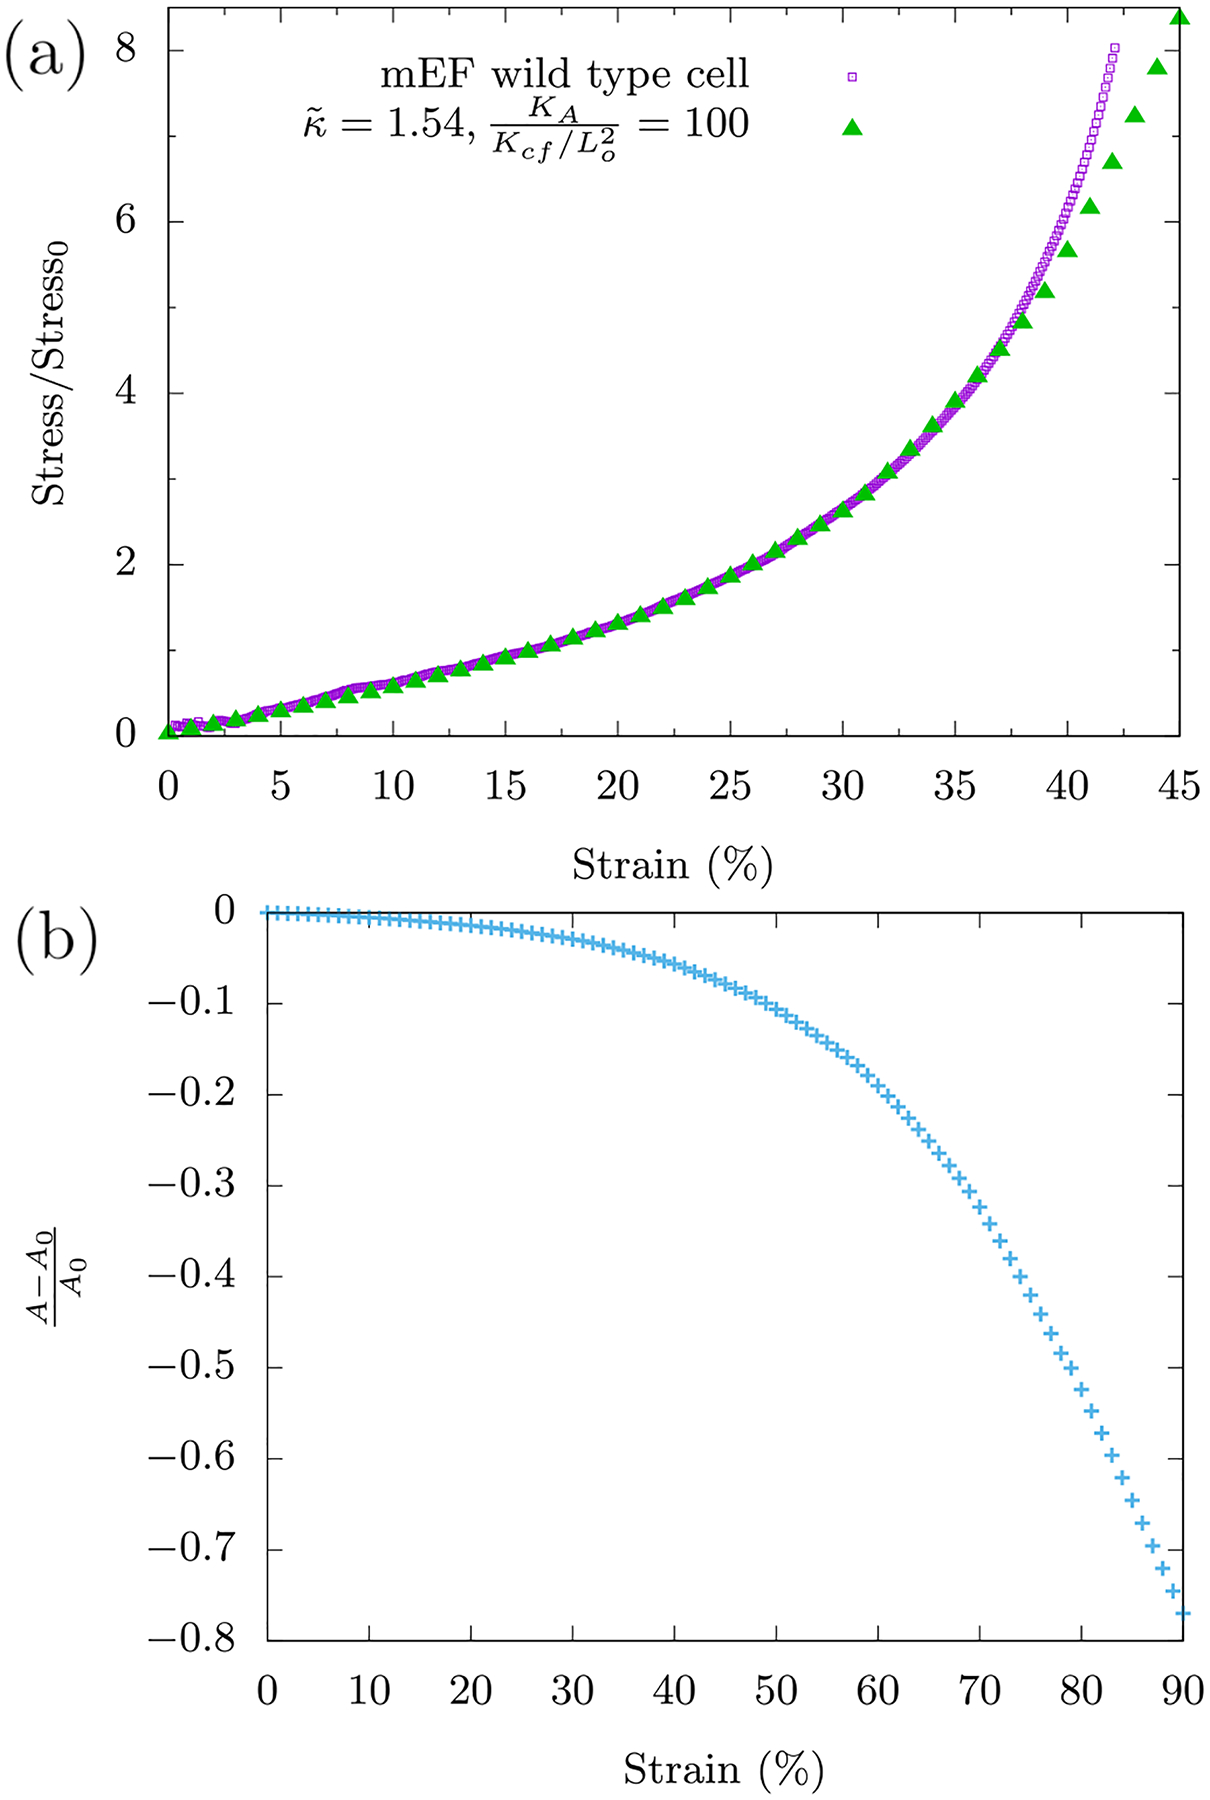
(a) Plot of the normalized stress versus strain curve from the experiments and the resulting fit. (b) Plot of the corresponding fractional change in area as a function of the compressive strain in the model.