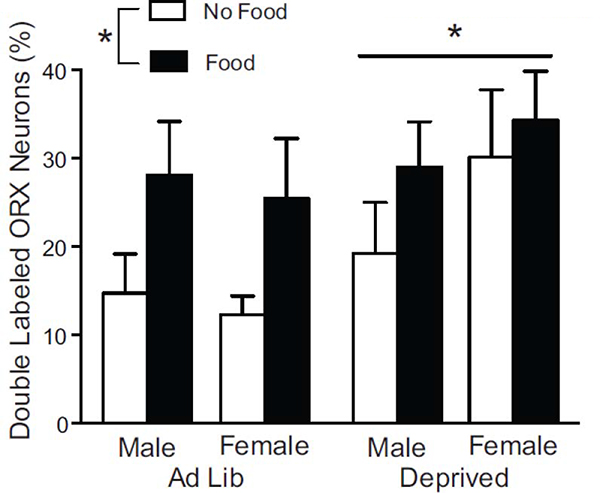
Figure 4.
Fos induction in ORX neurons. Graphs show the percentage of total ORX neurons that were labeled with Fos in male and female Ad Lib and Deprived groups that either received food or no food during testing (mean ± SEM). * indicates a difference (p < 0.05) between Ad Lib and Deprived and between Food and No Food conditions (N=7–8/group; N=29 for each Ad Lib, Deprived, Food, and NoFood conditions).

