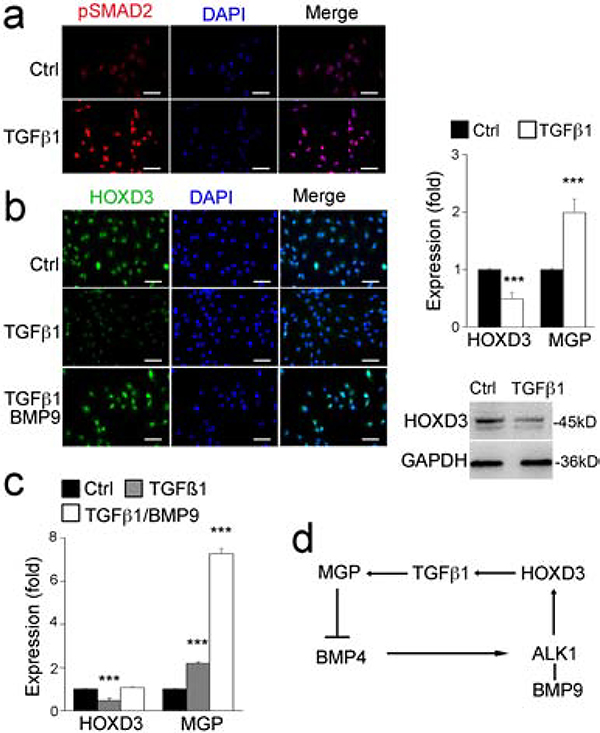
Figure 5. TGFβ1 feedback regulates the expression of BMP9, HOXD3 and MGP.
(a) Level of pSMAD2 in HUVECs after treatment with TGFβ1 as shown by immunostaining.
(b-c), Expression of HOXD3 and MGP in HUVECs after treatment with TGFβ1, with or without BMP9, shown by real-time PCR, immunostaining and immunoblotting.
(d) Schematic diagram.
Data were analyzed by Student’s t test. ***, P<0.001. Error bars are standard deviation. ***, P < 0.001. Scale bar, 50 μm.

