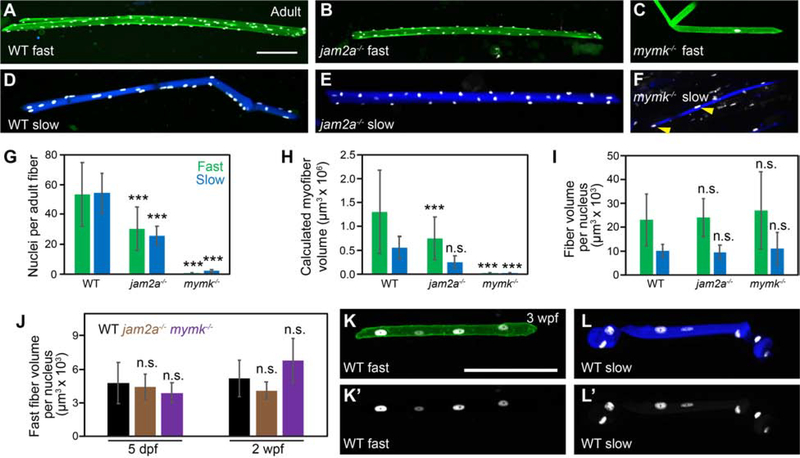
Figure 7: Fast and slow myofiber size is tightly correlated to myonuclei number in both wild-type and fusion-impaired mutant fish.
(A-F) Individual myofibers were isolated from wild-type (WT) (A, D), jam2ahu3319 mutant (B, E) and mymkoz17 mutant (C, F) adults. Myonuclei are marked by expression of the myog:H2B-mRFP transgene (white), fast myofibers by the mylfpa:lyn-cyan transgene (A-C, green), and slow myofibers by the smyhc1:EGFP transgene (D-F, blue). Yellow arrowheads indicate two of the nuclei in a mymkoz17 mutant slow fiber (F). (G) Graph showing the average nuclei per fast (green) and slow (blue) myofiber isolated from WT, jam2a mutant, and mymk mutant adults. (H) Myofiber volume was calculated for the same isolated myofibers by measuring length, area, and then applying the formula for volume of a cylinder. (I) The average myofiber volume per nucleus, an approximation of myonuclear domain size, is similar for all fast myofibers and for all slow myofibers, regardless of genotype. (J) At earlier times, we also found no difference in fast muscle myonuclear domain size among WT (black), jam2ahu3319 mutant (brown), and mymkoz17 mutant (purple) larvae (myofiber volume per nucleus was calculated using 5 dpf and 2 wpf datasets from Figure 3). (K-L’) Individual fast (K) and slow (L) myofibers were isolated from 3 wpf WT fish, and shown as merged images, color-coded as above (K, L), and as myog:H2B-mRFP single channel images (K’, L’). Scale bars in A (for A-F) and K (for K-L’) are 100 μm. Significance determined by ANOVA and Tukey-Kramer post-hoc analysis (p*** < 0.001 compared to WT; n.s. indicates not significantly different from WT at P of 0.05).

