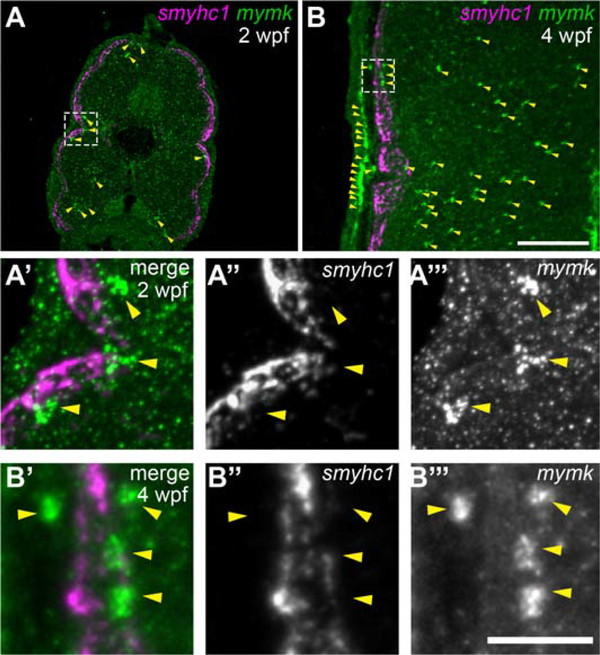
Figure 8: As slow muscle fusion ensues, mymk is expressed in cells near myofibers, but not in myofibers themselves.
(A-B) Transverse sections of wild-type larvae at 2 weeks post fertilization (wpf) (A) and 4 wpf (B), processed by fluorescent in situ hybridization (FISH) to detect smyhc1 (magenta) and mymk (green) transcripts; arrowheads (yellow) indicate a subset of the mymk-positive cells. Magnified images (A’ and B’) of boxed regions in A and B show that smyhc1 (A” and B”) and mymk (A”’ and B”’) are expressed in distinct cell types at both time points. Scale bar in B (for A, B) is 100 μm and in B”’ (for A’-B”’) is 25 μm.

