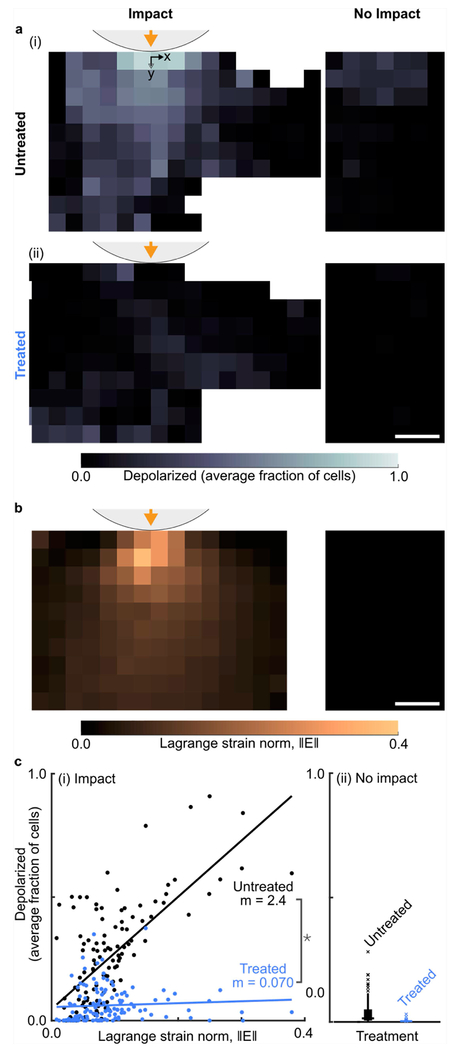
Figure 4. Treatment with SS-31 eliminates strain-induced mitochondrial depolarization.
(a) (i) Without treatment, the local fraction of cells with depolarized mitochondria is high near the impact location and decreases farther away, while non-impacted samples show nearly zero depolarization. (ii) In contrast, samples treated with SS-31 show minimal depolarization after impact, while depolarization in non-impacted samples remains nearly zero. Scale bar indicates 250 μm. (b) At peak displacement during impact, Lagrange strain norm is highest near the impact and decreases further away, while no-impact samples have zero strain, by definition. Scale bar indicates 250 μm. (c) (i) In impacted but untreated samples, depolarization is correlated with the local strain (p=8×10−308), but after SS-31 treatment this correlation is eliminated (p>0.01). Each point corresponds to one spatial bin. Lines indicate the best fit and m values indicate the associated strain norm coefficients (i.e. slope). Note: * indicates significantly reduced strain correlation after treatment (p=2×10−103). (ii) A Tukey box plot shows the distribution of fractional depolarization in non-impact samples (zero strain), which remains low for both treatment groups. All plots show depolarization at 15 minutes after impact and Lagrange strain at peak displacement during impact. Untreated and treated results reflect the response of paired samples from 5 and 4 animals, respectively. Statistical comparisons were evaluated using a mixed effects model (Supplementary Table S3).

