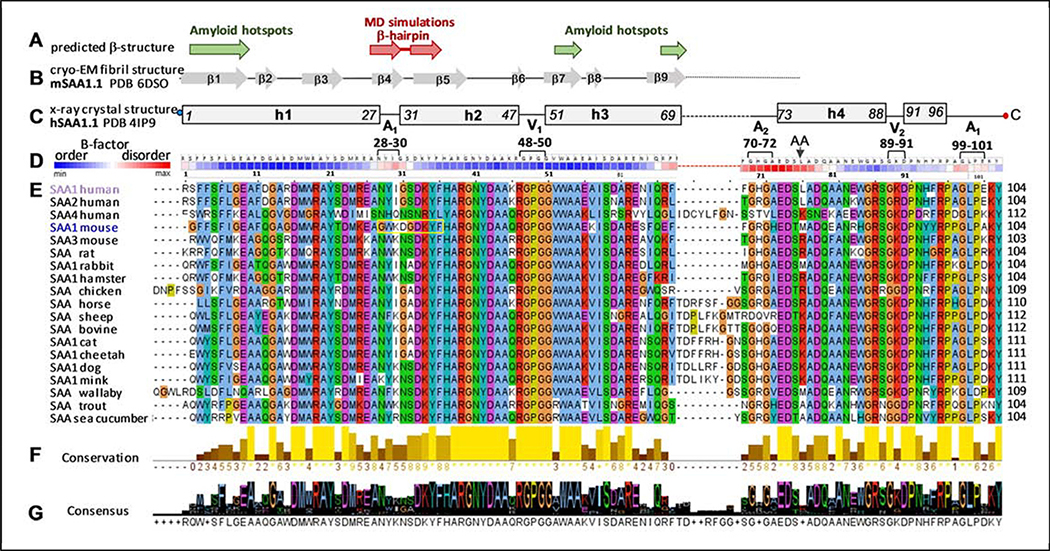
Figure 1.
Predicted and observed secondary structure and amino acid sequence conservation in the SAA protein family. The residue numbers correspond to human SAA1.
(A) Predicted β-sheet structure. Green arrows show residue segments predicted to initiate β-aggregation in SAA, or “amyloid hotspots” [15]; brown arrows show the β-hairpin predicted by MD simulations of the current study.
(B) Linear diagram shows β-sheets observed in the AA amyloid structure, derived from mSAA1.1 (PDB: 6DSO); arrows represent β-strands and lines are turns/loops [34].
(C) Linear diagram depicts secondary structure observed by x-ray crystallography (PDB 4IP9) in lipid-free hSAA1.1 [31]. Rectangles show α-helices h1-h4 and a 3/10 helix h’; first and last residue numbers in each helix are indicated. Lines show turn/coil regions; dashed line indicates the variable h3-h4 linker. Apices 1 and 2 (A1, A2) and vertices 1 and 2 (V1, V2) are indicated, along with their residue numbers (see Figure 2 for detail). Residues numbering is according to human SAA1 that has an additional N-terminal Gly compared to murine SAA1.
(D) Temperature factors of the Cα atoms from the crystal structure of hSAA1.1 (PDB: 4IP9); the B-factors are color-coding as shown, from low to high (blue to red). Similar B-factor distribution was observed in all nine symmetry-unrelated SAA molecules from the four available crystal structures of hSAA1 and mSAA3 (PDB: 4IP8, 4IP9, 4Q5G, 6PY0) in four different space groups; therefore, this B-factor distribution was determined by factors other than lattice contacts. Amino acids are shown for hSAA1. Black arrow shows the major cleavage site that generates AA fragment found in the in vivo deposits.
(E) The conservation table lists amino acid sequences of 19 SAA proteins. The sequence alignment was performed using Clustal Omega server [64] and the results were displayed using Jalview, http://www.jalview.org/ [65]. Conserved residues are color-coded: apolar (blue), polar (green), acidic (purple), basic (red), Pro (yellow), Gly (orange). Yellow box highlights the β-hairpin observed in our MD simulations of mSAA1.
(F) Conservation plot shows more conserved residues in lighter colors; the bar height represents the number of tabulated SAA sequences wherein each residue is conserved.
(G) Consensus plot shows the predominant residues in each position.

