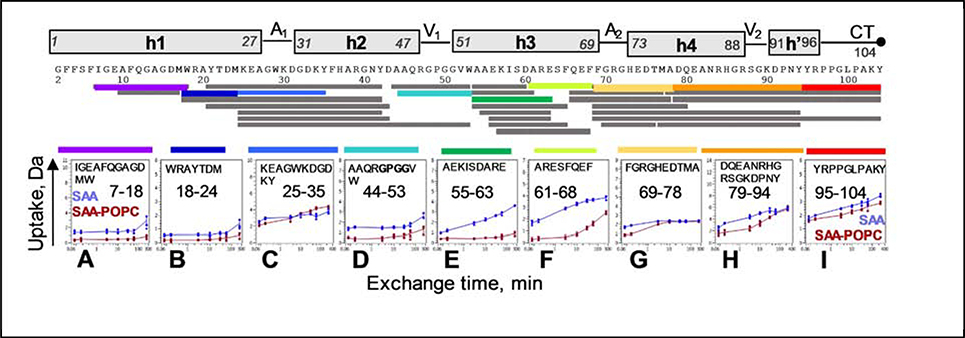
Figure 3.
Deuterium uptake plots for selected regions of lipid-free SAA (blue) and SAA-POPC (red). Error bars for individual time points represent the range for multiple charge states (varies per peptide) from the combined results of multiple replicates (described in Table S1 and in Methods). Residue numbers for representative peptides are indicated. Linear representation of the SAA secondary structure observed by crystallography is shown at the top. Apices 1 and 2 (A1, A2), vertices 1 and 2 1 (V1, V2), and the C-terminal tail (CT) are indicated; Figure 2A shows their locations in the crystal structure. Peptide coverage map for lipid-free SAA and SAA-POPC at 5 °C is shown above the uptake plots. Each bar r epresents a peptic peptide fragment of SAA detected by MS. Selected fragments whose uptake plots are displayed are color-coded.

