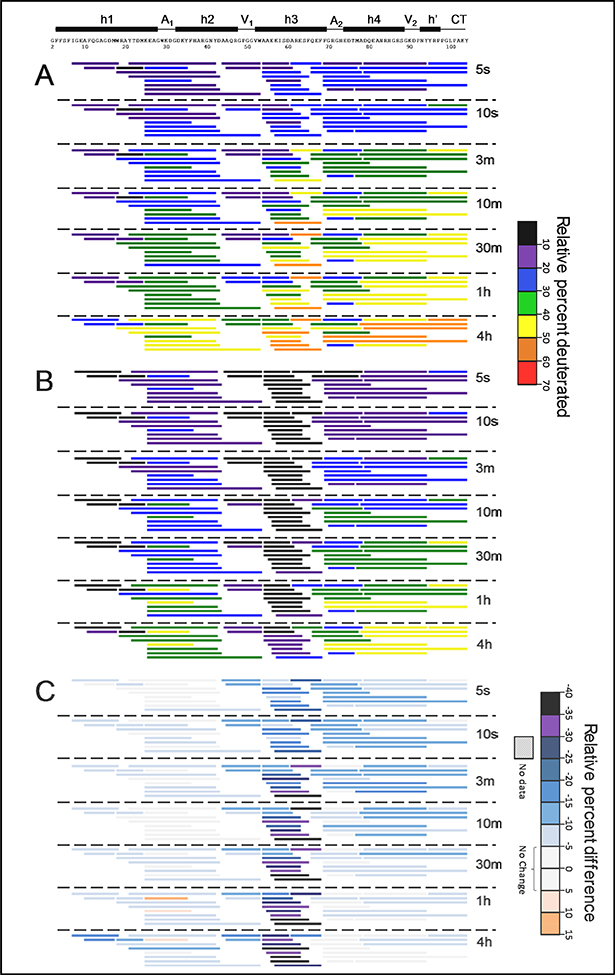
Figure 4.
Relative deuterium incorporation at 5 °C of all pep tides in lipid-free SAA (A), in SAA-POPC (B), and their difference (C) where subtraction was performed as DSAA-POPC – DSAA. The relative percent deuteration scale for panels A and B is used to color each peptide from black/violet (low uptake, high structural protection) to red (high uptake, low structural protection). The deuteration difference scale for panel C indicates less deuteration (negative numbers and colors) in SAA-POPC. Similar data at 15 °C and 25 ° C are shown in Figures S4, S5.

