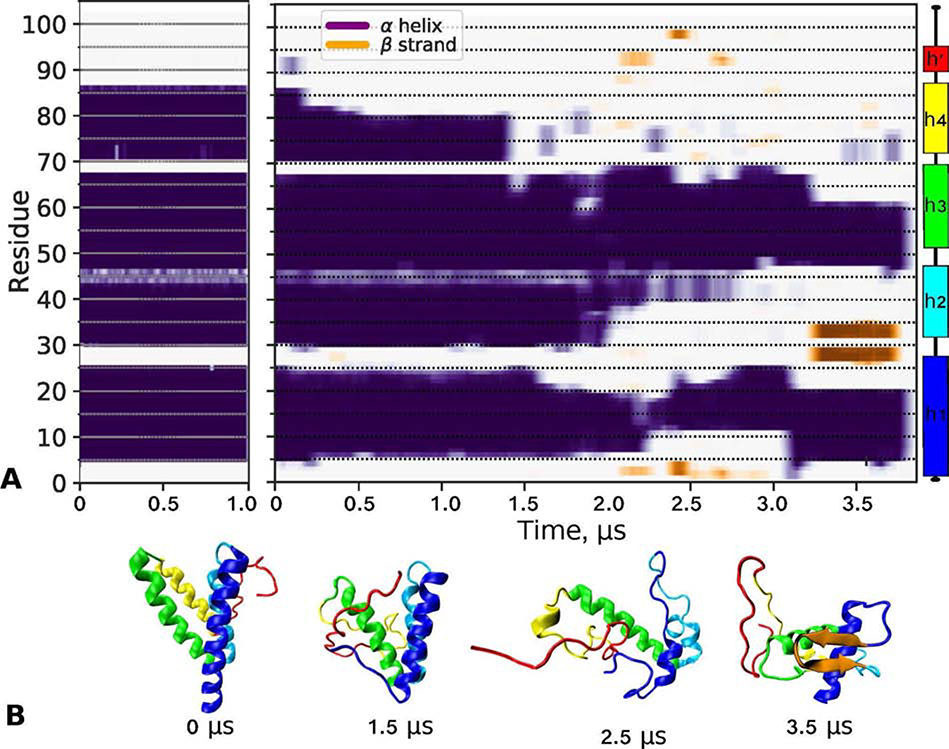
Figure 6.
Low- and high-temperature simulations of lipid free SAA monomer in solution. The starting model, denoted SAA68, was obtained from the x-ray crystal structure of hSAA1 (PDB ID: 4IP8) as shown in Figure S9. The structure was simulated at 310 K for 1 μs and at 370 K for 3.8 μs as described in Methods.
(A) Time evolution of the secondary structure showing ⍺-helices (purple/blue) and β-sheets (orange) over the simulation trajectory at 310 K (left) and 370 K (right panel). The remaining structure (off-white) was turn/coil. Linear secondary structure model based on the hSAA1 crystal structure is color-coded.
(B) Representative molecular structures at indicated simulation times from the 370 K trajectory, from 0 μs (SAA68) to 3.5 μs. The orientation of h1 is similar in all figures. Color-coding: h1 (blue), h2 (teal), h3 (green), residue segment 70–104 (red), and β-sheet (orange).

