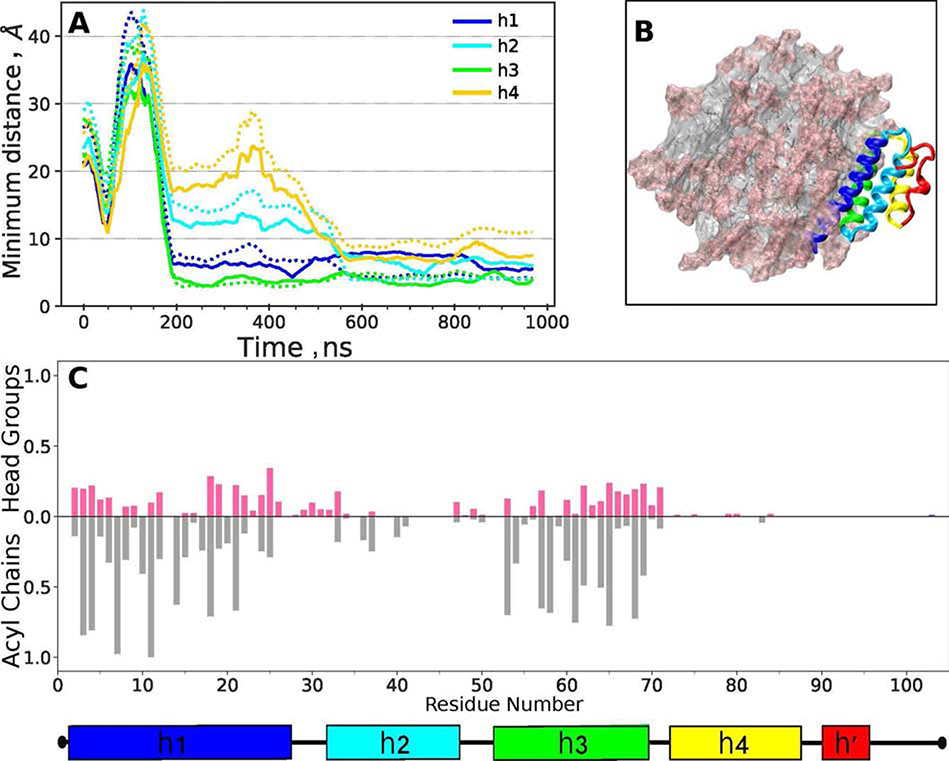
Figure 8.
Protein-lipid contacts in SAA-POPC68 model. SAA68 was oriented randomly in respect to the POPC micelle containing 72 lipid molecules, the system was simulated at 310 K for 1 μs (for detail see flowchart in Figure S8), and the last 0.5 μs of the trajectory were used for analysis.
(A) Average protein-lipid distances are plotted as a function of simulation time for individual SAA helices (color coded). Solid lines show distances involving phospholipid head groups, and dotted lines those involving acyl chains.
(B) Final configuration of the SAA-POPC68 system. Protein ribbon diagram shows h1 (blue), h2 (teal), h3 (green), h4 (yellow) and residue segment 70–104 (red). POPC head groups are in pink and acyl chains in grey.
(C) Fraction of frames showing SAA contacts with the POPC head groups (pink) and acyl chains (grey) per residue. A contact is defined as lipid atoms within 5 Å of protein atoms. Average results from R1-R3 simulations are shown.

