
Figure 4.
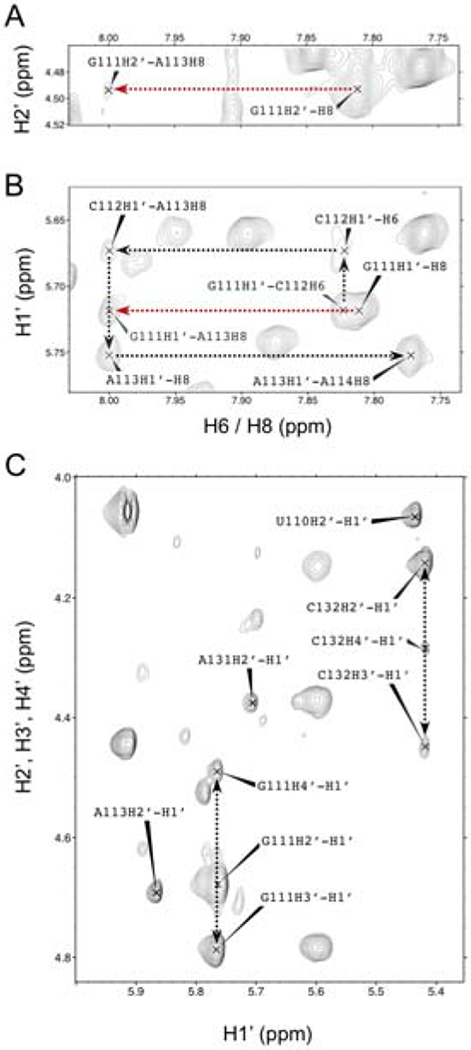
Regions of the D2O NOESY spectrum of TL1 exhibiting atypical NOE patterns for the upper internal loop region. Black dotted lines show sequential NOE interactions and deviations from standard helical patterns are represented as red dotted lines. (A) An atypical NOE cross-peak between G111-H2’ to A113-H8. (B) The H1’ to H6/H8 helical “walk” from G111 to A114. The red dotted line represents an atypical NOE interaction between G111-H1’ and A113-H8. (C) D2O TOCSY spectrum of TL1 TOP. Peaks between H1’ to H2’, H3’, and H4’ for G111 and C132 suggest deviation from canonical 3’-endo conformation to a mixed 2’-endo/3’-endo pattern.