Figure 3.
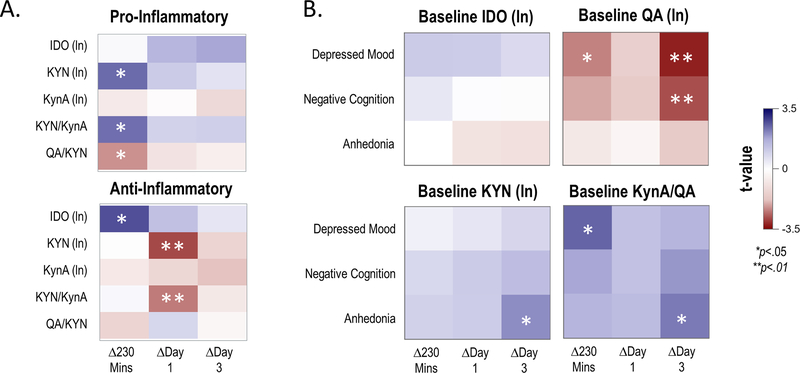
Baseline inflammatory cytokine component scores as moderators of change in the kynurenine (KYN) pathway (Panel A), and baseline KYN levels as moderators of change in depressive symptom ratings (Panel B).
Panel A: Results of a mixed model with component scores of pro-inflammatory (top) or anti-inflammatory (bottom) cytokines entered as moderators of change in KYN pathway analytes (Y-axis) at three time points post-ketamine infusion (X-axis). T-values (all df=24) for the simple slope of the moderator for change at each time point are plotted; positive values indicate that higher cytokine component scores were associated with increases in respective KYN pathway analytes, and negative values indicate that higher cytokine component scores were associated with decreases in respective KYN pathway analytes.
Panel B: Results of a mixed model with baseline KYN pathway member entered as a moderator of change in depressive symptom ratings (Y-axis) post-ketamine infusion. T-values (all df=33) for the simple slope of the moderator for change at each time point are plotted; positive values indicate that higher baseline KYN pathway concentrations were associated with less improvement in depressive symptoms, and negative values indicate that higher baseline KYN pathway concentrations were associated with more improvement in depressive symptoms. In both models, age, body mass index (BMI), and type of mood stabilizer were included as covariates. Results of the full analysis can be found in Supplementary Table S5 and Supplementary Table S6.
IDO: indoleamine 2,3-dioxygenase; KYN: kynurenine; KynA: kynurenic acid; QA: quinolinic acid.

