Fig. 1.
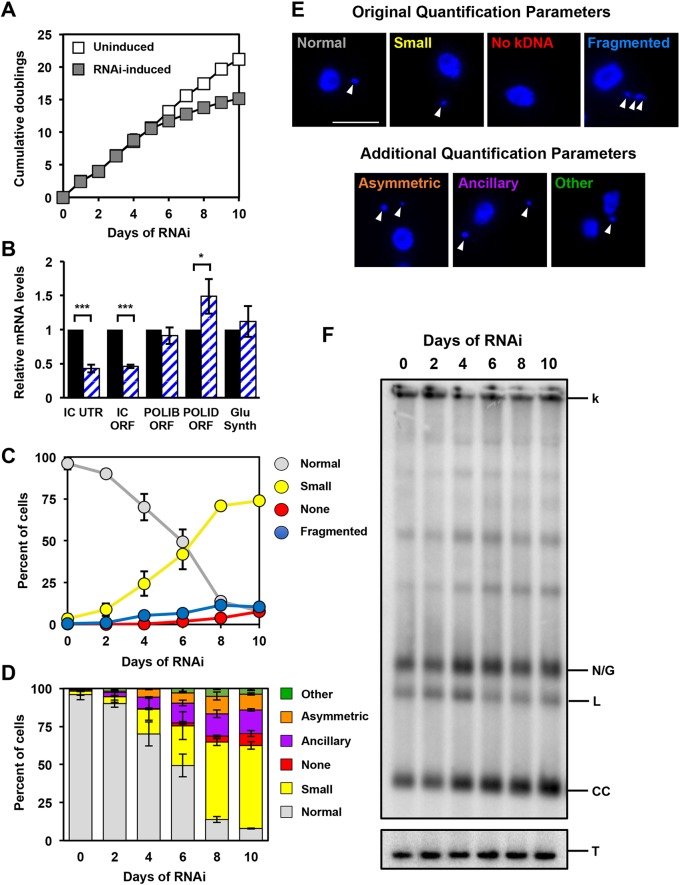
Phenotype of POLIC 3′UTR-targeted depletion. (A) Growth curves of uninduced and RNAi-induced procyclic T. brucei cells. Error bars represent the ±s.d. of the mean from three biological replicates. Error bars are too small to be displayed with respect to the size of the icon. (B) RT-qPCR analysis of uninduced (black) and tetracycline-induced (blue/white hashed) IC-UTR cells after 48 h of growth. Data are normalized to TERT and error bars represent the ±s.d. of the mean from three biological replicates. IC UTR, POLIC 3′ untranslated region; IC ORF, POLIC open reading frame; IB ORF, POLIB open reading frame; ID ORF, POLID open reading frame; Glu Synth, gene encoding glutathione synthetase. Asterisks indicate statistical significance based on pairwise Student's t-test. *P<0.1; **P<0.01; ***P<0.001. (C) Quantification of kDNA morphology by applying categories according to Klingbeil et al., 2002; i.e. Normal, Small, None and Fragmented. Over 300 DAPI-stained cells were scored at each time point and error bars represent the ±s.d. of the mean from three biological replicates. (D) Quantification of kDNA morphology utilizing new categories. Over 300 DAPI-stained cells were scored at each time point and error bars represent the ±s.d. of the mean from three biological replicates. (E) Representative images for the various kDNA phenotypes. Scale bar, 5 µm. (F) Representative Southern blot showing the increase in free minicircle species during IC 3′-UTR silencing. k, kDNA network; N/G, nicked/gapped; L, linearized; CC, covalently closed; T, tubulin.

