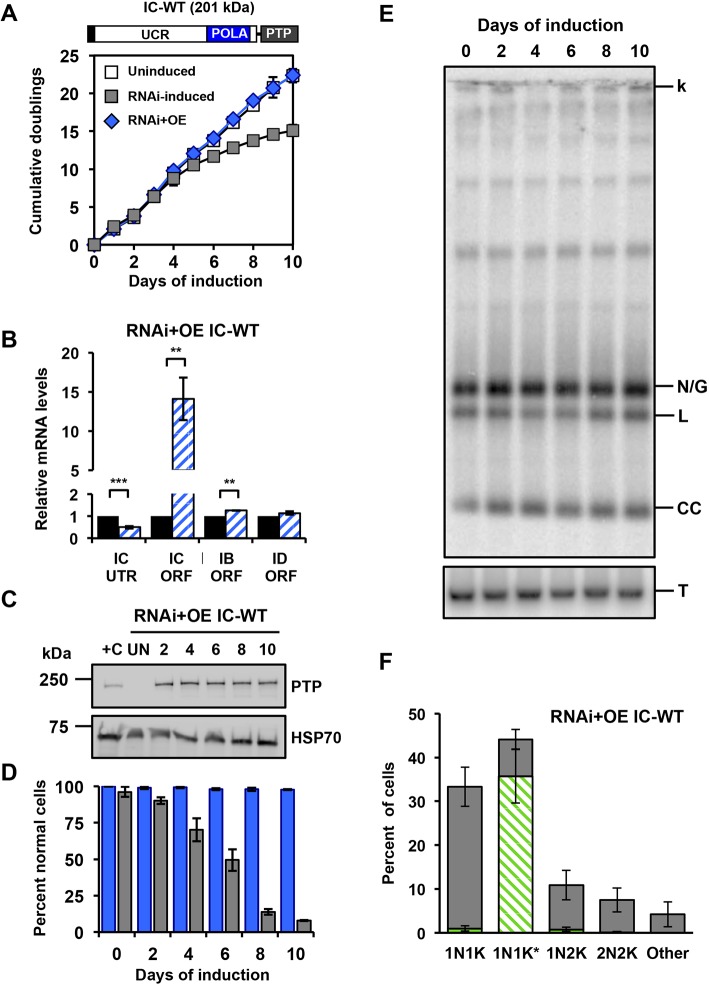
Fig. 2.
Rescue with ectopically expressed IC-WT in the IC-UTR RNAi T. brucei cell line. (A) Schematic representation of full-length POLIC with the C-terminal PTP tag. Growth curves of uninduced, RNAi complementation with IC-WT, parental IC-UTR RNAi procyclic cells. Error bars represent the ±s.d. of the mean from three biological replicates. (B) RT-qPCR analysis of uninduced (black) and induced (blue/white hashed) cells following 48 h of tetracycline induction. Data are normalized to TERT and error bars represent the ±s.d. of the mean from three biological replicates. **P<0.01;***P<0.001. IC UTR, POLIC 3′ untranslated region; IC ORF, POLIC open reading frame; IB ORF, POLIB open reading frame; ID ORF, POLID open reading frame. (C) Western blot detection of the PTP tag and HSP70 over 10 days of induced complementation. At each time point, the equivalent of 1×10⁶ cells was loaded into each well, except for +C where the equivalent of 5×10⁶ cells was loaded. +C, single-allele-expressing control cell line endogenously expressing epitope-tagged POLIC. (D) Quantification of kDNA phenotypes. Over 300 DAPI-stained cells were scored at each time point, error bars represent the ±s.d. of the mean from three biological replicates. Blue bars, IC-WT complementation; gray bars, POLIC RNAi. Specific kDNA phenotype information can be found in Fig. 1E. (E) Representative Southern blot showing no change in the free minicircle population. k, kDNA network; N/G, nicked/gapped; L, linearized; CC, covalently closed; T, tubulin. (F) Quantification of PTP foci formation at each cell cycle stage. Percentages refer to the fraction of total cells in the population. Green/white hashed, foci positive; gray, foci negative.

