Fig. 4.
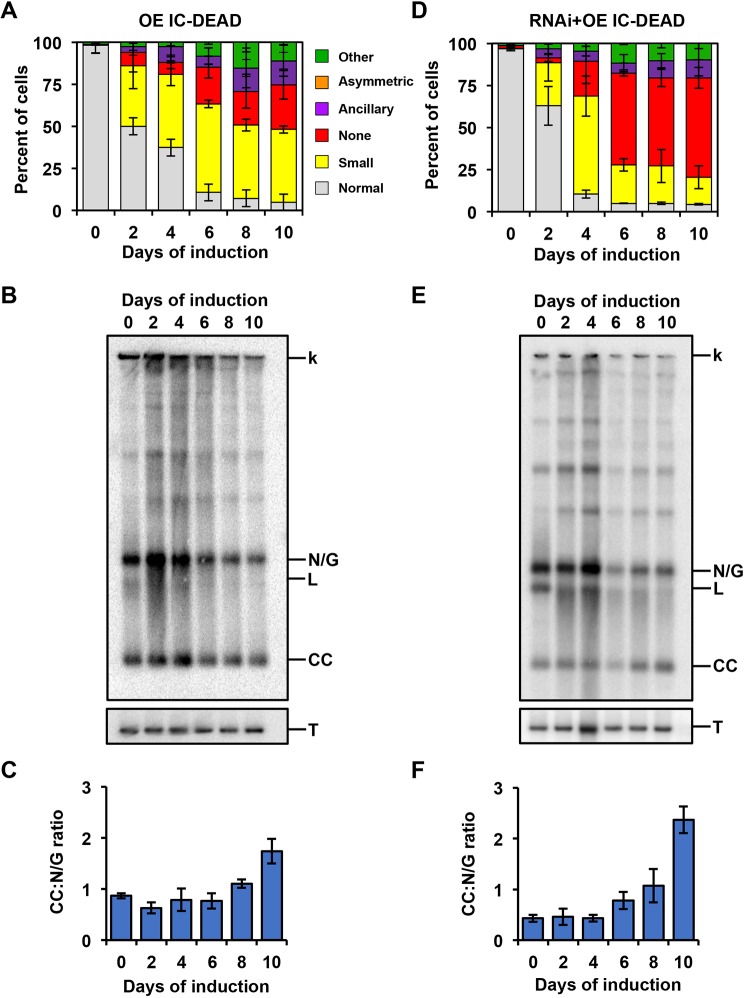
Analyses of the kDNA replication phenotype in response to IC-DEAD overexpression and complementation. (A) Quantification of kDNA morphology for OE IC-DEAD over the course of the induction demonstrating progressive loss of kDNA. Over 300 DAPI-stained cells were scored at each time point and error bars represent the ±s.d. of the mean from three biological replicates. Gray, normal kDNA; yellow, small kDNA; red, no kDNA; purple, ancillary kDNA; orange, asymmetric size; green, other. (B) Representative Southern blot showing the effect on free minicircle population. k, kDNA network; N/G, nicked/gapped; L, linearized; CC, covalently closed; T, tubulin. (C) Ratio of CC:N/G over the course of the induction. Phosphoimager quantification was used to plot the relative abundance of nonreplicated CC and newly replicated N/G intermediates. Error bars represent the ±s.d. of the mean from three biological replicates. (D–F) Same as A–C but for the RNAi+IC-DEAD cell line.

