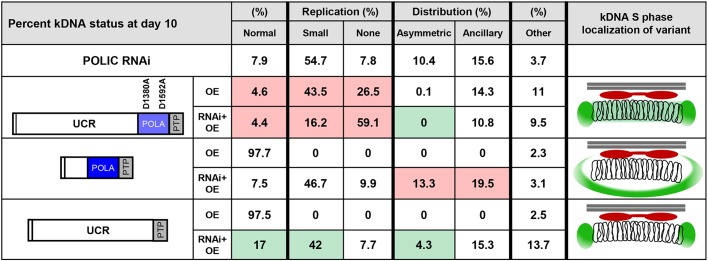
Fig. 8.
Summary of POLIC variant phenotypes and effect on kDNA network. kDNA status is shown as the percentage of total cells 10 days post induction (OE or RNAi+OE). Analyzed were two types of observed defect, i.e. replication and distribution. Replication defects are divided into 'Small' and 'None' defects; distribution defects are divided into 'Asymmetric' and 'Ancillary' defects. 'Other' refers to cells displaying any other non-normal nucleus and kDNA karyotype. Colored boxes indicate the number of cells suggesting biologically significant improved (green), worsened (red) or unchanged (white) conditions compared to the parental POLIC RNAi phenotype. The respective localization pattern during kDNA S phase is displayed on the right. In each image, the mitochondrial membrane is depicted as two parallel horizontal lines (gray), TAC102 is depicted in red, the POLIC variant is depicted in green and the catenated ring structures represent the kDNA network.

