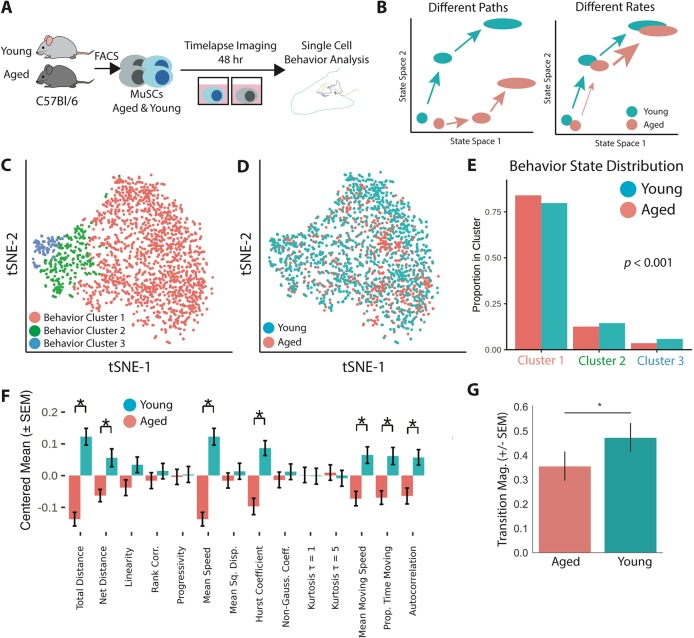
Fig. 1.
Aged MuSCs display lower cell motility and delayed activation by single cell behavior analysis. (A) Experimental schematic. MuSCs were isolated and imaged on a time-lapse microscope for 48 h. Tracking was performed from 10 h to 35 h. (B) Diagram of the different paths and different rates models for age-related decline in muscle stem cell regenerative capacity. (C) t-SNE visualization of cell behavior state space with color overlay of hierarchical clustering identities (aged animals: n=742 cells; young animals: n=1201 cells). (D) t-SNE visualization of cell ages in cell behavior space. (E) Aged cells display a significant preference for less-motile behavior clusters (χ2 test, age × behavior cluster contingency table, P<0.001). (F) Young cells are significantly more motile than aged cells, suggesting that aged cells are delayed in activation. Mean feature values are presented for each age after centering the population mean to μ=0 and scaling the variance to σ2=1 (*P<0.05, two-tailed unpaired Student's t-test, Holm–Bonferroni corrected). (G) Aged cells have significantly decreased behavior state transition magnitude (two-tailed unpaired Student's t-test, *P<0.05), suggesting delayed activation. State transition magnitude in behavior space is measured as the magnitude of the mean transition vector.

