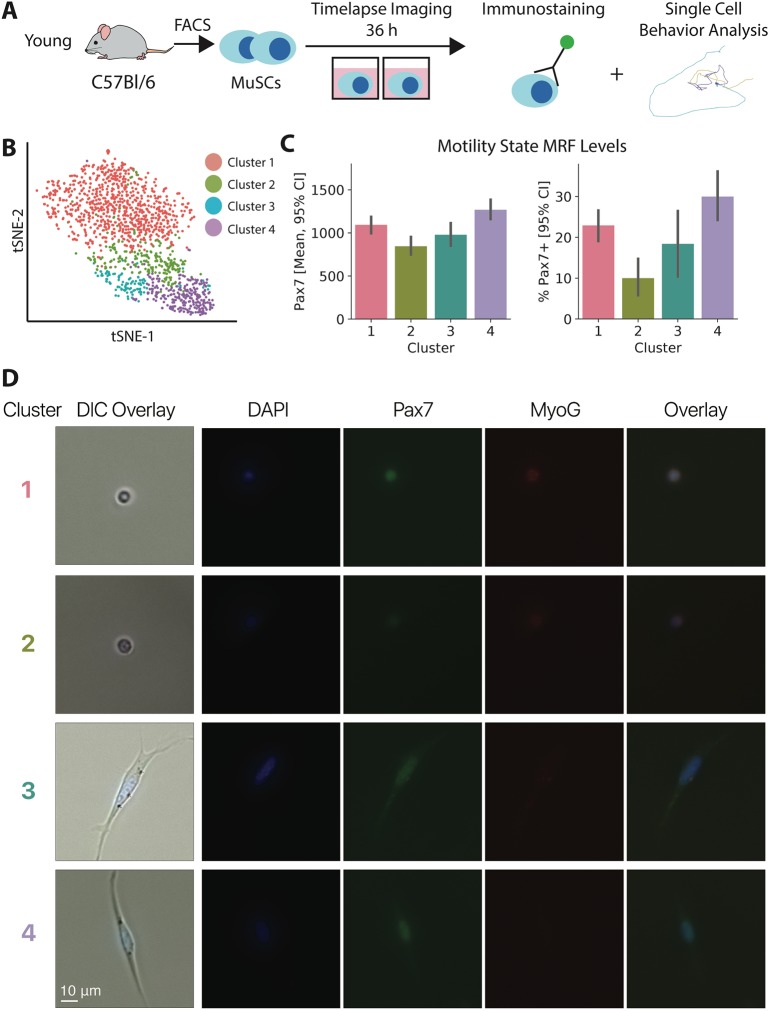
Fig. 3.
Pax7 is non-monotonically regulated across MuSC cell behavior states during activation. (A) Experimental design schematic. MuSCs were isolated, time-lapse imaged in culture for 36 h, and subsequently immunostained. Behavior traces and immunostaining results were matched for each cell by image registration. (B) t-SNE visualization of behavior clusters in motility state space, as defined by hierarchical clustering. Behavior state space was generated by analyzing 12 h of tracking data, from 24 h after isolation to 36 h (n=1003 cells, 1 animal). (C) Pax7 immunostaining intensity (cell median) and binary frequency within each cell behavior cluster. Both quantification schemes show a non-monotonic relationship between behavioral activation state and Pax7 intensity (95% confidence intervals from 1000 bootstrap samples). (D) Representative images of Pax7 and MyoG staining in MuSCs after time-lapse imaging for behavior analysis in each behavior cluster. Panels on the far left are the final DIC image from the time lapse, registered and overlaid with fluorescent immunostains. Remaining panels are fluorescent images prior to registration. Fluorescence images are equitably rescaled across cells within each channel for presentation.

