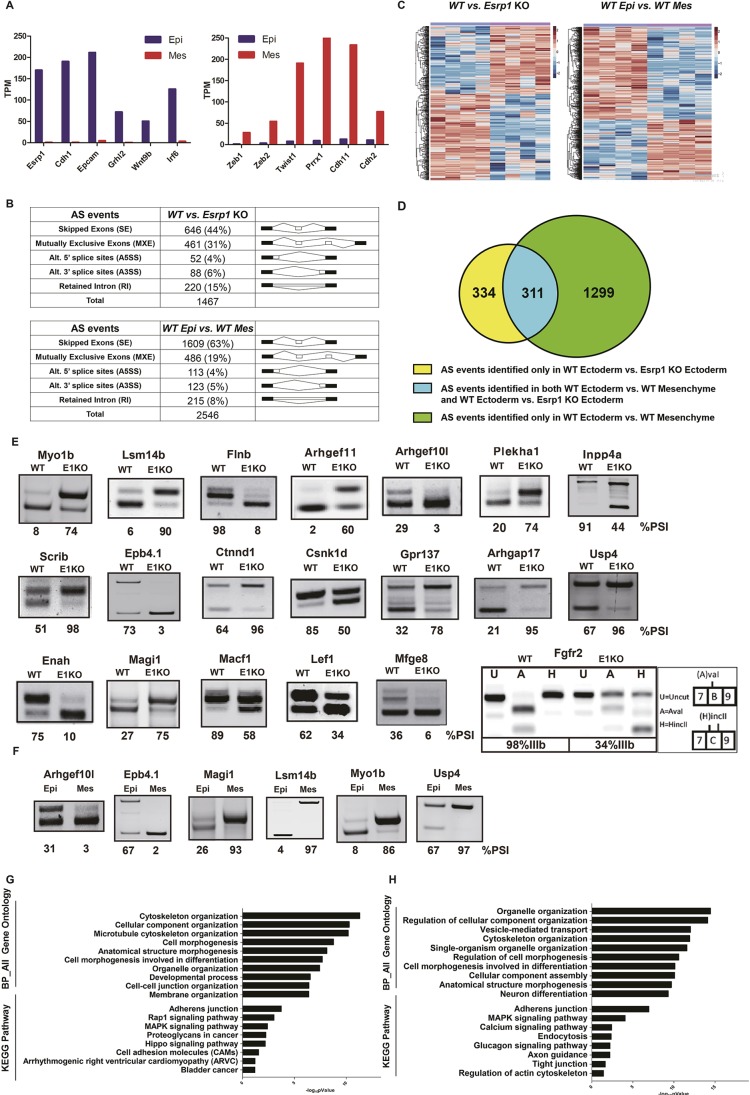
Fig. 4.
RNA-Seq identified large-scale alterations in alternative splicing in Esrp1−/− ectoderm compared with WT ectoderm and differences in alternative splicing between WT ectoderm and WT mesenchyme. (A) Expression of epithelial markers (left) and mesenchymal markers (right) validates efficient separation of epithelial cells from mesenchymal cells in WT samples. TPM, transcripts per million. (B) Summary derived from Tables S1 and S2 showing both the total number and percentage of the different types of alternative splicing events in WT versus Esrp1−/− ectoderm (top) and in WT ectoderm versus WT mesenchyme (bottom) identified by rMATS with false discovery rate (FDR)<5%, and |deltaPSI|≥5%. (C) Heatmap representing the skipped exon (SE) splicing changes with increased exon inclusion (red) or decreased exon inclusion (blue). (D) Venn diagram depicting detected SE events identified in WT ectoderm versus Esrp1 KO ectoderm (yellow), WT ectoderm versus WT mesenchyme (green), and those identified in both comparison sets (blue). (E) RT-PCR validations of changes in splicing of cassette exons Esrp1−/− ectoderm (E1KO) compared with WT. The ‘percent spliced in’ (PSI) value indicates the percentage exon inclusion for each event. Also shown is the change in splicing of mutually exclusive exons IIIb and IIIc of Fgfr2. Products containing each exon were distinguished by restriction digests with AvaI and HincII, which cut products containing exon IIIb and IIIc, respectively. (F) Validation of several differences in splicing between control ectoderm and mesenchyme. (G) GO and KEGG pathway enrichment for genes with alternative splicing differences between WT ectoderm and Esrp1−/− ectoderm. (H) GO and KEGG pathway enrichment for genes with splicing differences between WT ectoderm and WT mesenchyme.

