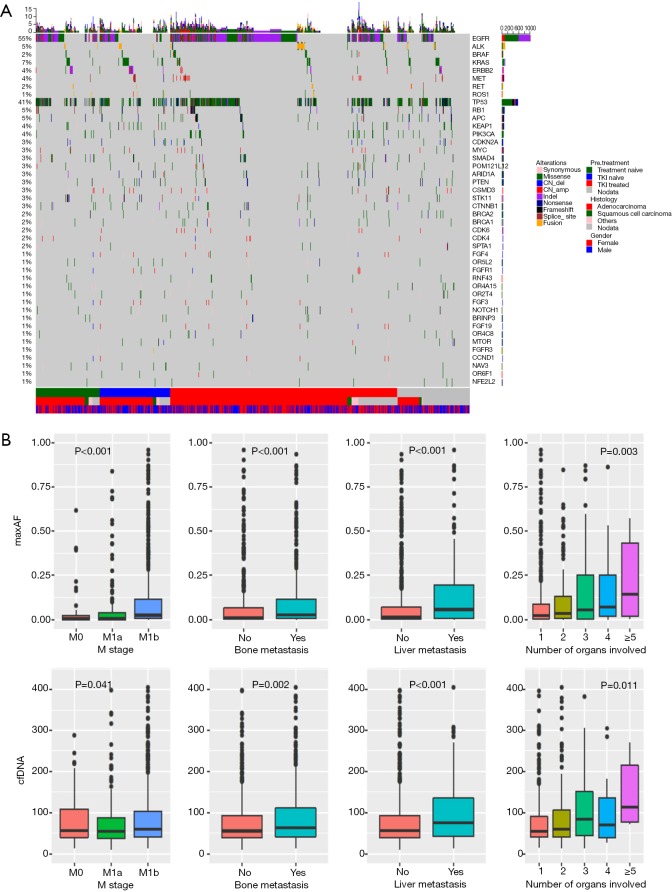
Figure 2.
Mutations identified in baseline plasma samples. (A) OncoPrint of mutations identified at baseline of the screened cohort. Different colors denote different types of mutations. Top bar represents the number of mutations a patient carries; side bar represents the number of patients carry a certain mutation. Bottom bars provide information regarding histology, gender and treatment history. (B) Clinical characteristics (M stage, presence of bone metastasis, presence of liver metastasis and number of organs with lesions) associated with maxAF and cfDNA. Pearson or t-test correlation test was applied for continuous variables or binary variables, respectively. Boxplots of both variables over the dichotomized clinical features are shown.

