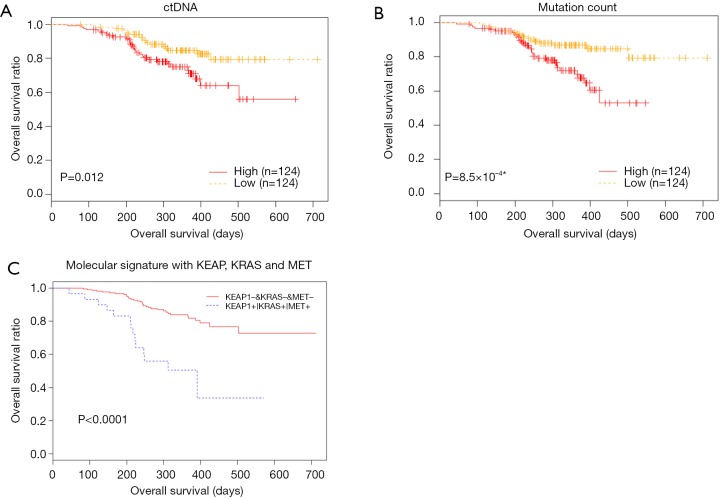
Figure 3.
Correlation between baseline characteristics and overall survival. (A) ctDNA. (B) Mutation count. (C) A signature consisting of KEAP1, KRAS and MET can predict OS. Patients with no mutation in the above 3 genes have a longer OS than patients with mutation in any one of the above 3 genes. *, denotes P value derived from cox regression model.

