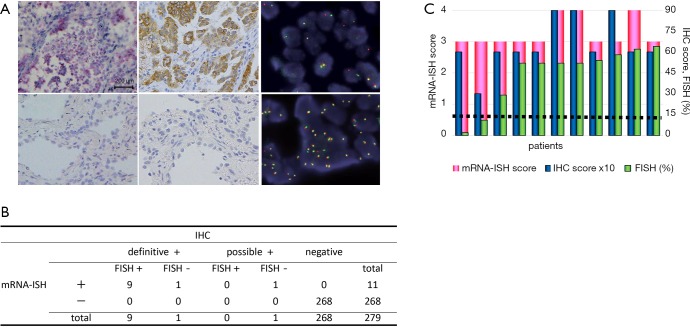
Figure 2.
Data summary. (A) Upper panels: ALK-positive sample (patient No. 9), lower panels: ALK negative control. Left panels: mRNA-ISH, middle panels: IHC, right panels: FISH (original magnification, ×400). Representative micrographs of mRNA-ISH, IHC, and FISH are shown. Red dots or clusters were observed if ALK mRNA was present. Patient No. 9 displayed abundant clusters throughout the tumor and was assigned a score of 4. Scale bar: 200 μm. (B) Comparison of mRNA-ISH, IHC, and FISH data for the surgically resected samples. No samples were only positive by mRNA-ISH. Positive mRNA-ISH results were found for all definitively or possibly positive IHC samples. (C) Graphical comparison of the mRNA-ISH score, the IHC score (the product of the staining-intensity and proportion scores), and the FISH results (% positive cells) for 11 IHC/ISH-positive patients. The left vertical axis indicates mRNA-ISH score. The right vertical axis indicates the IHC score (×10) and FISH score (% positive cells). The horizontal dotted line indicates the 15% FISH cutoff. The patients’ data are ordered from left to right in the order of ascending ALK-FISH-positive cells (%). ALK, anaplastic lymphoma receptor tyrosine kinase; IHC, immunohistochemistry; ISH, in situ hybridization; FISH, fluorescence in situ hybridization.

