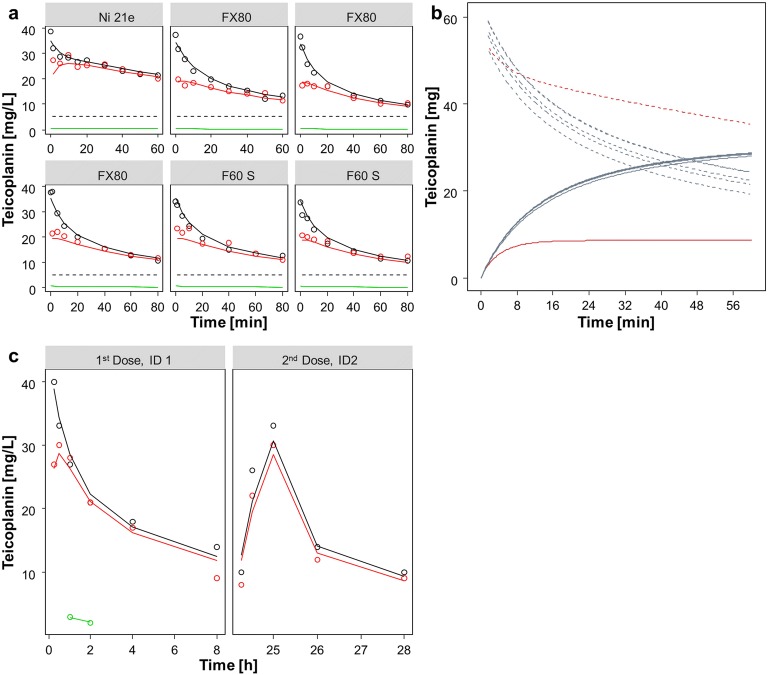
Fig. 5.
(a) individual fits teicoplanin in vitro, points: observation, solid lines: individual model fit, black: pre- filter plasma, red: post-filter plasma, green: effluent, dashed line: lower limit of quantification. (b) mass balance teicoplanin in vitro, solid lines: amount adsorbed to the dialysis membrane, dashed line: amount of drug in plasma, red: triacetate membrane, blue: polysulphone membrane. (c) individual fits teicoplanin in vivo, points: observation, solid lines: individual model fit, black: pre- filter plasma, red: post-filter plasma, green: effluent.

