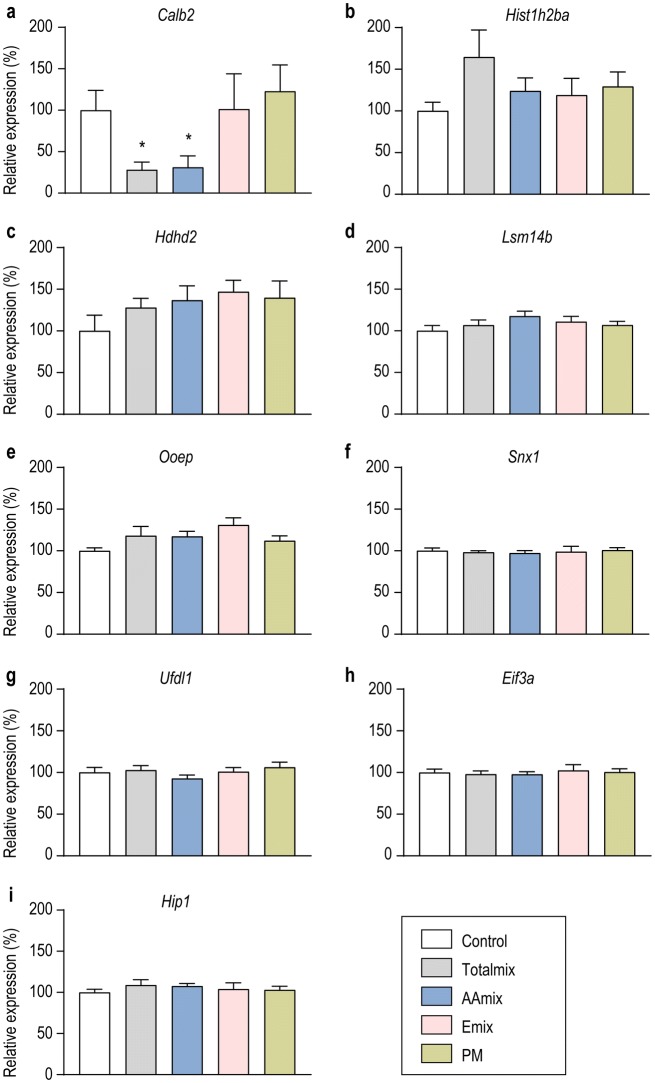
Fig. 2.
Gene expression analysis for the nine proteins that were dysregulated in more than one exposure group. aCalb2 transcript expression was significantly downregulated following exposure to Totalmix (P = 0.03) or AAmix (P = 0.003). b–i No significant effects on expression levels of the remaining 8 genes encoding proteins that were dysregulated in more than one exposure group were seen (data is presented as mean ± SEM, *P < 0.05, **P < 0.01, n = 9/exposure group)

