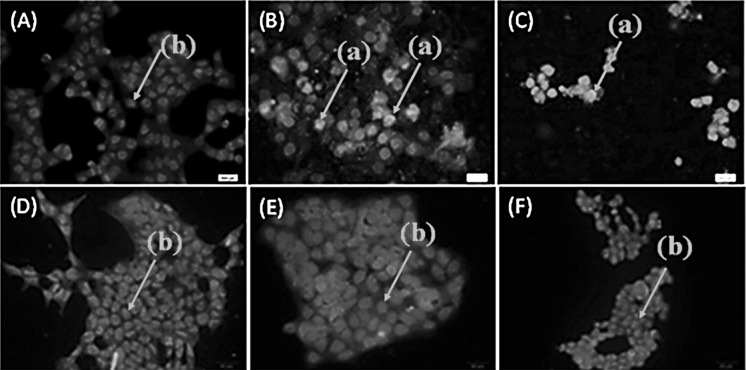
Fig. 2.
DAPI staining of treated/untreated HSC4 and KDR cells. A Represents untreated HSC4, B treated with cell-free supernatant (60 µL/mL) HSC4, and C treated with cisplatin (IC50) HSC4. D Represent untreated KDR, E treated with cell-free supernatant (60 µL/mL) KDR, and F treated with cisplatin (IC50) KDR cells. The incubation time was 24 h. The arrows either labeled with an (a) or (b) point to condensed and normal cell nuclei respectively. The condensed nuclei represent apoptotic/necrotic cells

