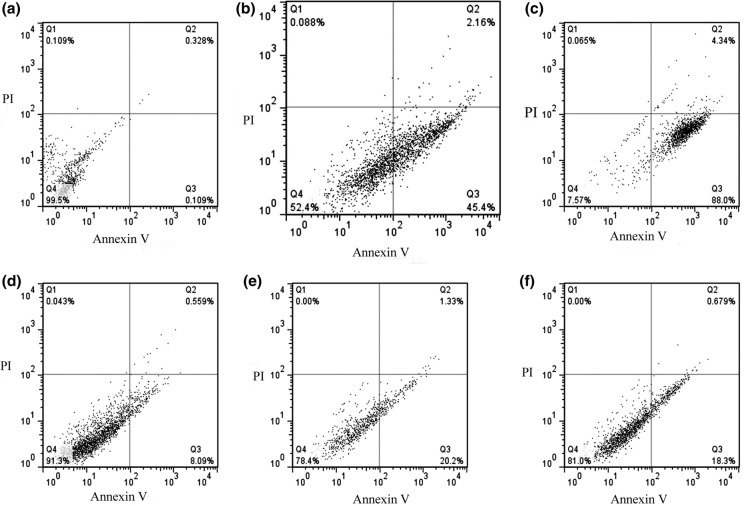
Fig. 3.
Flow cytometric analysis of treated/untreated HSC4 and KDR cells. a–c Represent untreated, treated with cell-free supernatant (60 µL/mL), and treated with cisplatin (IC50) at HSC4 cells and d–f represent untreated, treated with cell-free supernatant (60 µL/mL), and treated with cisplatin (IC50) at KDR cells respectively for 24 h incubation. Dots with Annexin V−/PI+ (Q1), Annexin V+/PI+ (Q2), Annexin V+/PI− (Q3), and Annexin V−/PI− (Q4) and feature represent necrotically, late apoptotic, early apoptotic, and viable intact cells respectively. All experiments were performed in triplicate

