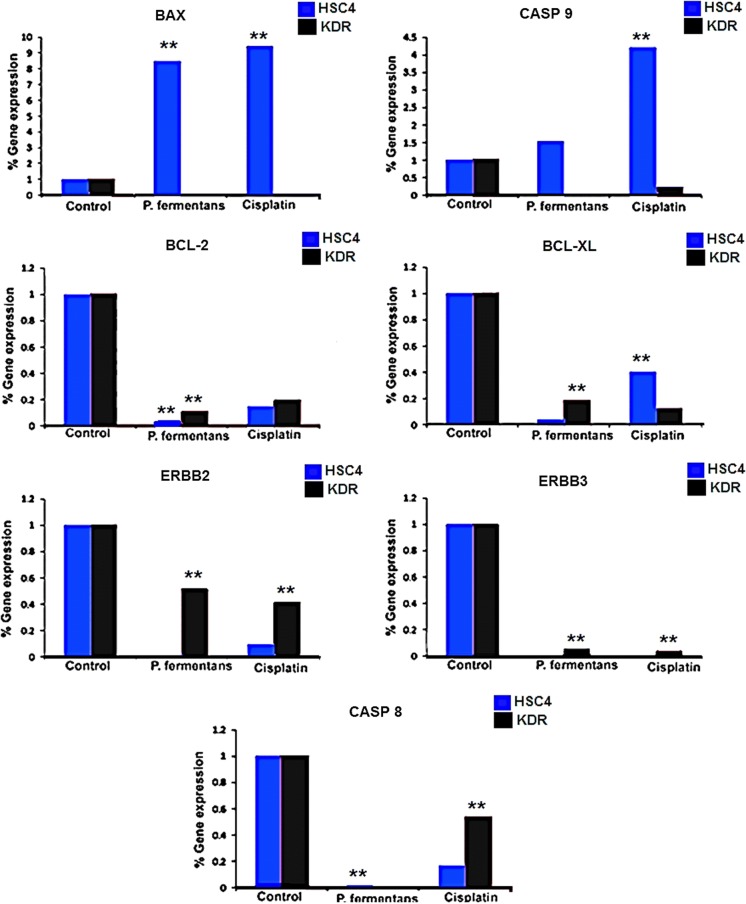
Fig. 4.
Apoptosis-related gene expression ratio in treated (60 µL P. fermentans YSH secretion metabolites) and untreated control HSC4 and KDR cells for 24 h. Asterisks denote statistically significant differences (**p ≤ 0.01). All experiments were performed independently in triplicate. (Color figure online)

