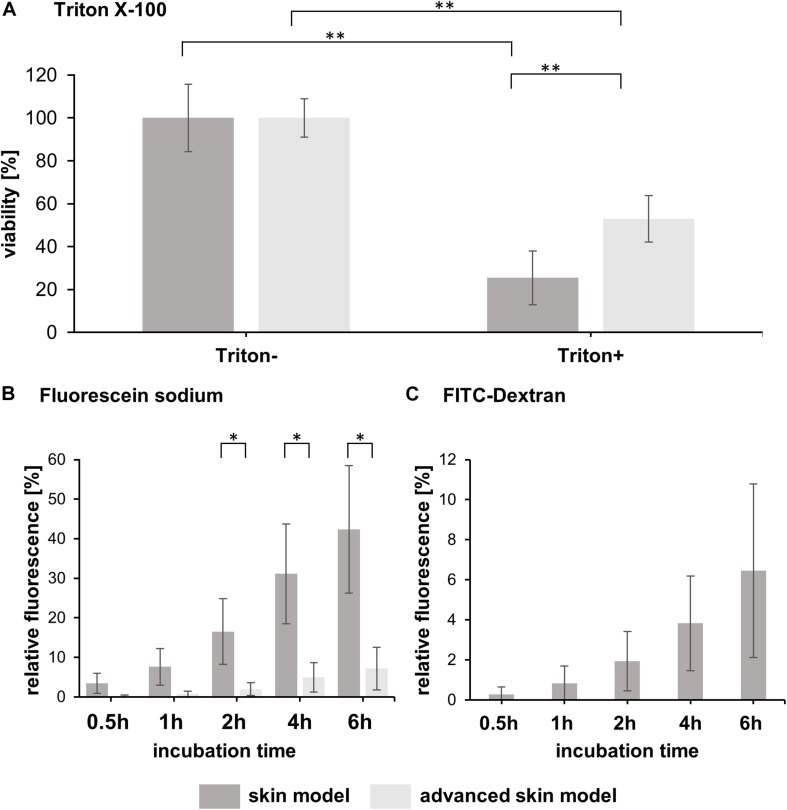
FIGURE 3.
Analysis of skin model barrier function. (A) The bar graph shows the percentual viability of skin models and advanced skin models after treatment with (Triton+) and without a detergent (Triton-) (n = 3). The values were normalized to the untreated skin model/advanced skin model which was set to 100%. Level of significance ∗∗p < 0.01. (B) Fluorescein sodium and (C) FITC-dextran were applied topically to the skin models and permeability was assessed over a time period of 6 h with sampling at 0.5, 1, 2, 4, and 6 h after application. The bar graphs depict the percentage of relative fluorescence values normalized to a reference which was set to 100% (fluorescent stock solution in cell culture medium). For FITC-dextran, only values for skin models are shown, as the values for the advanced skin models were below the detection limit. Mean values are presented with SD (n = 3). Level of significance ∗p < 0.05.

