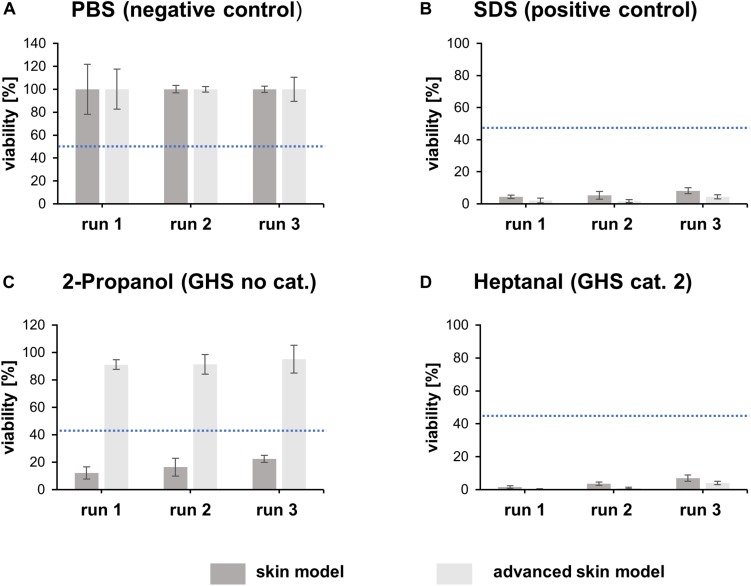
FIGURE 6.
Irritation test with heptanal, SDS, 2-propanol and PBS. The bar graphs represent the percentual viability of skin models/advanced skin models after treatment with PBS (A), SDS (B), 2-propanol (C), and heptanal (D). Treatment with PBS was set as negative control and treatment with SDS as positive control. All values were normalized to the negative control (set to 100%). Mean values are displayed with SD. Dashed blue lines highlight the threshold of 50% viability compared to the negative control (n = 3).

