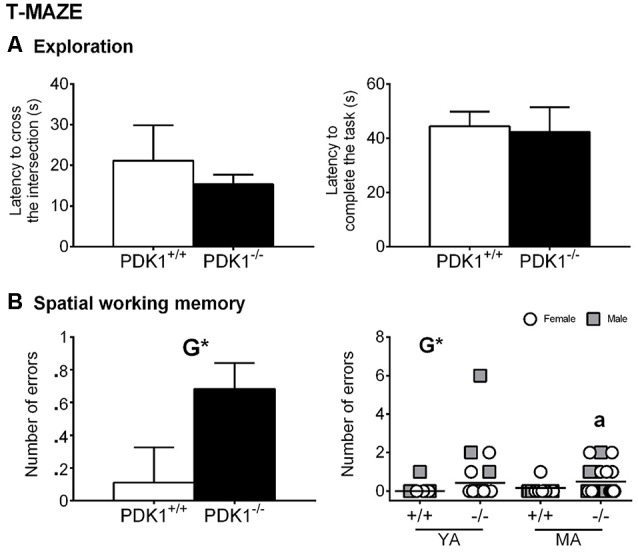
Figure 5.

Spontaneous alternation in the T-maze in young adult (YA) and mature age (MA) PDK1−/− and age-matched wild-type (WT; PDK1+/+) mice. Data are expressed as the mean ± SEM. Symbols are used to illustrate individual values of females (white circles) and males (gray squares) for each genotype and age group. Factorial analysis: G, genotype effect, *P < 0.05. Post hoc test: age (a), aP < 0.05 vs. the corresponding YA of the same genotype.
