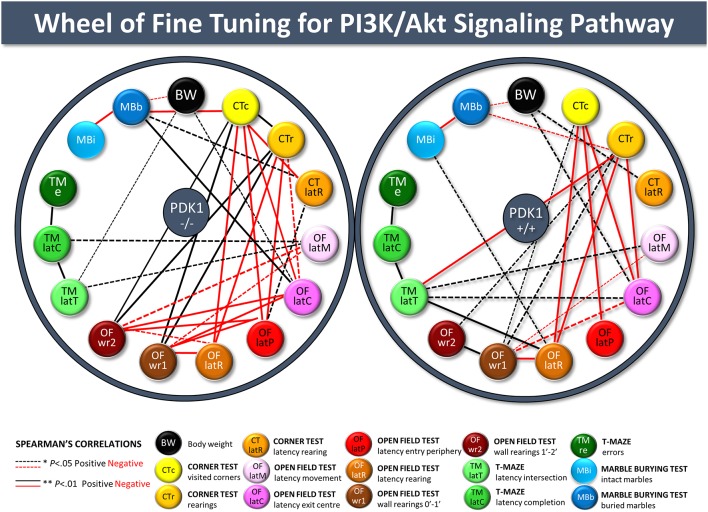
Figure 7.
Wheels of fine-tuning for the PI3K/Akt signaling pathway. Illustration of the meaningful behavioral correlates among variables of the different tests in the whole sample of animals, PDK1−/− and age-matched wild-type (WT; PDK1+/+) mice. Spearman’s correlation analyzed the relationship between behavioral variables of the four behavioral tests and with somatic growth (body weight). *P value < 0.05 was taken as statistically significant. Positive (black) and negative (red) statistically significant correlations are plotted, with thickness of the dotted (*P < 0.05) and unbroken (**P < 0.01) lines being proportional to the statistically significant value of the correlation.

