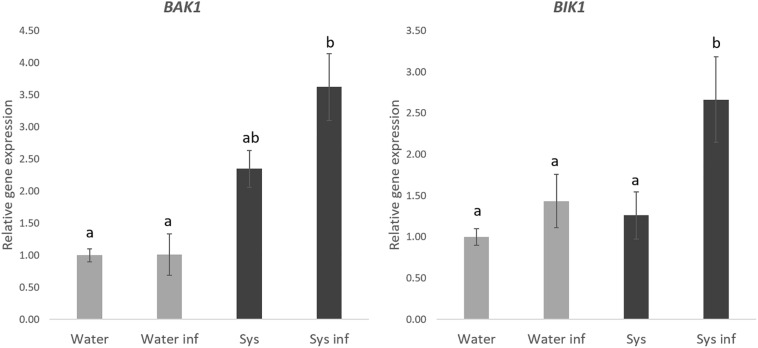
FIGURE 6.
Systemin treatment impact in BAK1 and BIK1 gene expression. Quantitative reverse transcription-polymerase chain reaction (qPCR)analysis of BAK1 and BIK1 in seedlings 48 h after P. cucumerina infection in normal water plants “W,” water infected plants “W inf,” 0.1 nM Systemin treated “Sys” and Sys infected plants “Sys inf” plants. Bars represent mean ± standard error (SD), n = 6. Different letters represent statistically significant differences (ANOVA, Fisher’s Least Significant Difference (LSD) test; P < 0.05, n = 6).

