
Figure 1.
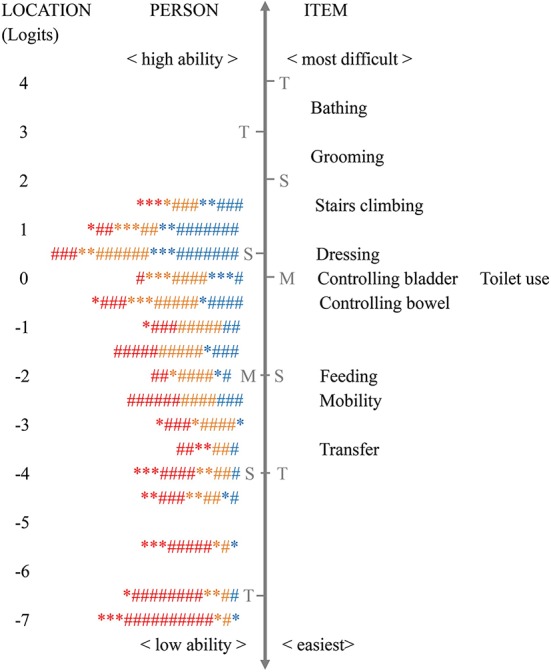
The Wright person–item map of the Barthel Index for assessing patients with mild (blue symbol), moderate (orange symbol), and severe dementia (red symbol) (n = 644). Note: each “*” = 1 person, and each “#” = 4 persons; M, mean person ability or mean item difficulty; S, one standard deviation; T, two standard deviations; CDR, Clinical Dementia Rating. The vertical line is a continuum representing the measures of person ability (left side) and item difficulty (right side), plotted in logit units. The person ability and item difficulty increase from the bottom to the top.