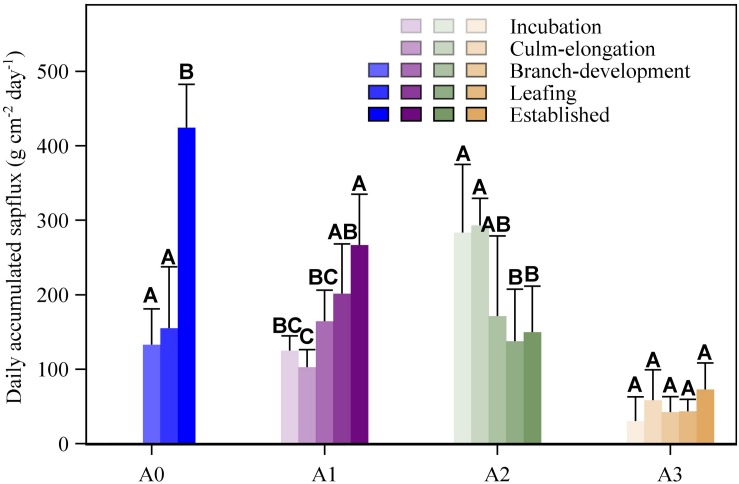
FIGURE 7.
Comparison of daily accumulated sap flux density (g m–2 day–1) of the five phenological periods in each four bamboo age categories. Different capital letters on the top of the bar indicate significant differences in daily accumulated sap flux among five phenological periods for a specific age category.

