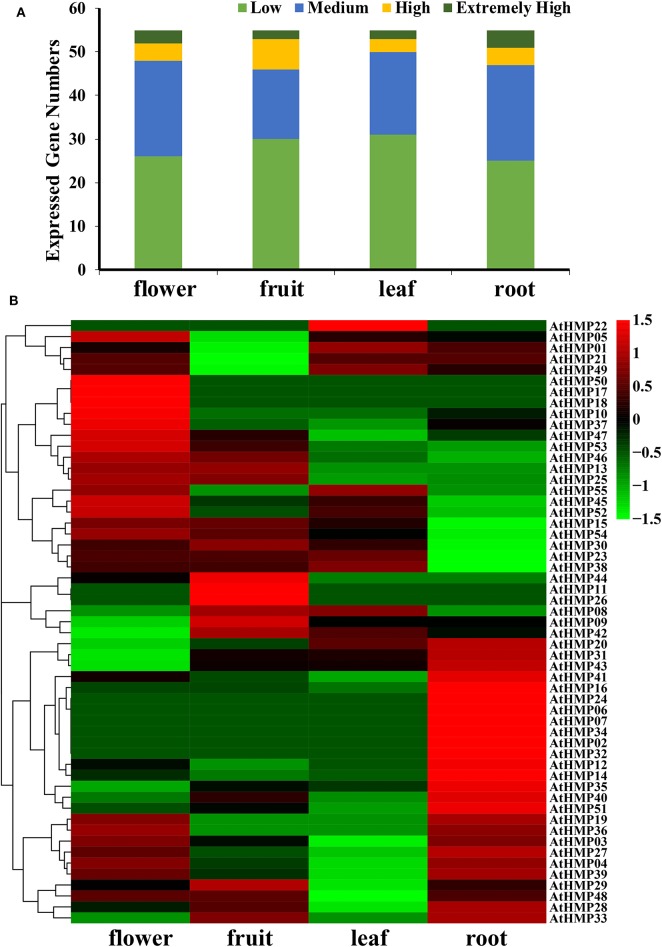
Figure 11.
Expression pattern of the Arabidopsis heavy-metal-associated gene family in various tissues or stages. (A) Numbers of expressed genes in each organ. Expression data of the Arabidopsis HMP genes were downloaded from the Expression Atlas database. Extremely high: TPM > 100, high: 100 ≥ TPM > 50, medium: 50 ≥ TPM > 5, low: 5 ≥ TPM > 0; (B) Expression patterns of the Arabidopsis HMP genes in various tissues. Heatmaps were generated using HemI from the normalized value by row for the signatures in transcripts per million (TPM). Transcript levels are depicted by different colors on the scale. Green and red represent low and high expression levels, respectively.

