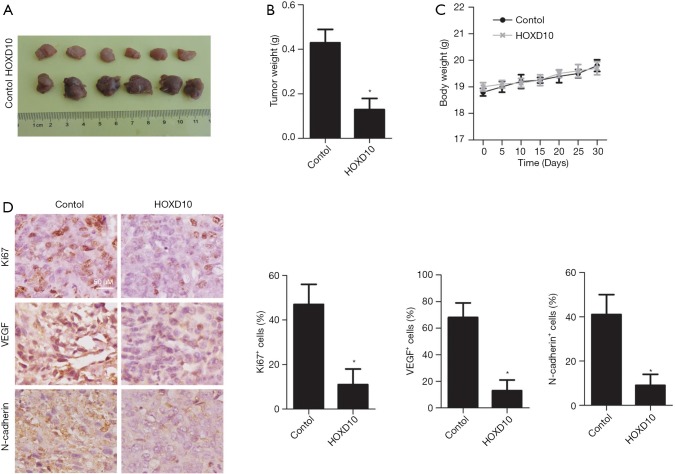
Figure 5.
Effects of HOXD10 overexpression in PANC-1 xenograft mice. (A,B) Tumor weight and volume in the control and HOXD10 groups. (C) Body weight of the mice in different groups. (D) Ki67, VEGF, and N-cadherin expression levels in the control and HOXD10 xenografts. *, P<0.05 with t test, data are shown as mean ± SEM of at least 3 replicates. VEGF, vascular endothelial growth factor.

