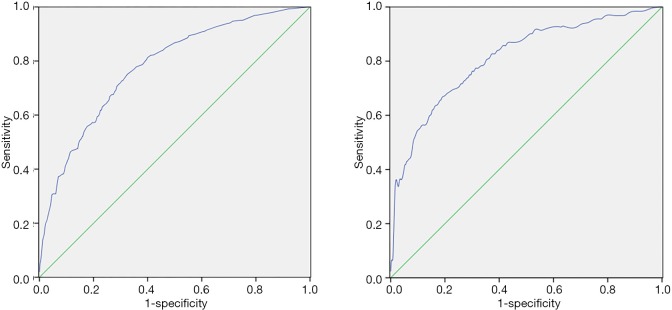
Figure 2.
The ROC. (A) Modeling group; (B) Validation group. The AUC of the model was 0.778 (95% CI: 0.751–0.803) with a sensitivity of 77.0% and a specificity of 65.0% using a cut-off value of 8 points. The predictive model yielded an AUC of 0.811 (95% CI: 0.781–0.839) with a cut-off value of 8 points, and the model had sensitivity of 82.5% and specificity of 63.2% in validation group. ROC, receiver operating characteristic; AUC, area under the curve.

