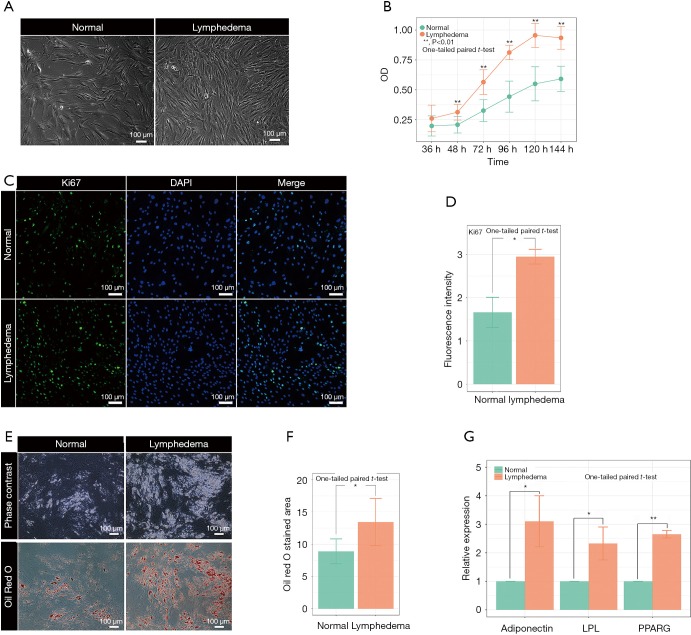
Figure 2.
Evaluation of the proliferative capacity and differentiation potential of ASCs derived from lymphedema tissue (lymphedema group) and normal adipose tissue (normal group). (A) Representative photos of the lymphedema group and normal group cultured for 72 h. Bar =100 µm; (B) the division potential of lymphedema group and normal group ASCs from 3 random donors at different time points (36, 48, 72, 96, 120 and 144 h) was detected. Values were expressed as the mean ± SEM of three replicates, **, P<0.01 (one-tailed paired t-test); (C) representative pictures of immunofluorescence staining with Ki-67 in two groups of ASCs; (D) immunofluorescence staining with Ki-67 in two groups of ASCs of 3 random donors; 15 images of each condition were captured for statistical analysis. (one-tailed paired t-test). The signal intensity of ki67 was expressed as the mean ± SEM. Bar =100 µm; (E) representative pictures of ASCs stained with Oil Red O after adipogenesis induce; (F) ASCs induced to differentiate into adipocytes were stained with Oil Red O; 10 images of each condition were captured for statistical analysis. The areas stained with Oil Red O were expressed as the mean ± SEM (n=4). Bar =100 µm. *, P<0.05 (one-tailed paired t-test); (G) RT-qPCR detection of the expression of mature adipocyte markers adiponectin, LPL, and PPARG after adipogenesis. GAPDH as internal reference. *, P<0.05; **, P<0.01 (one-tailed paired t-test). ASCs, adipose-derived mesenchymal stem cells; RT-qPCR, quantitative reverse transcriptase-PCR.

