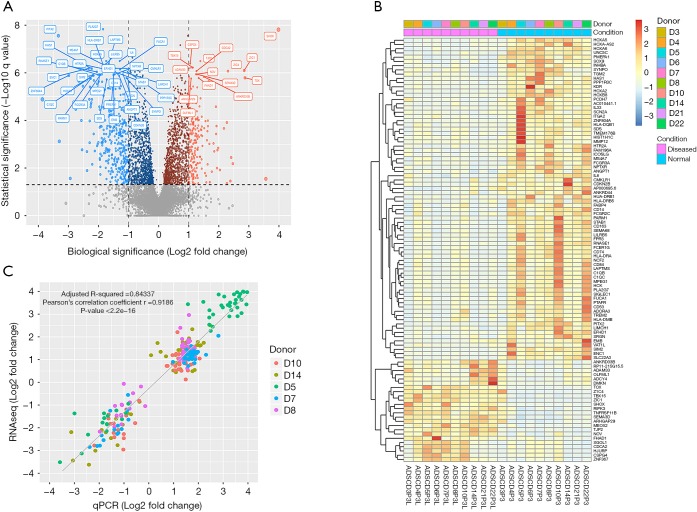
Figure 3.
DEGs of ASCs from lymphedema and normal adipose tissue from 10 donors. (A) Volcano plot showing FCs and q values of all expressed genes. The biological significance (X-axis) threshold was set to a FC of ±2-fold, and the statistical (Y-axis) significance threshold was set to a q value of 0.05 (–log10 q value >1.3). Dots in five different colors represent insignificant genes (gray), both statistically and biologically significant genes that are up-regulated (light red), both statistically and biologically significant genes that are down-regulated (light blue), only statistically significant genes that are up-regulated (dark red) and only statistically significant genes that are down-regulated (dark red). The dot size reflects the absolute FC. The top 50 DEGs ranked by q value were labeled with their gene symbols; (B) heatmap showing the expression levels of the top 100 DEGs across 20 ASC samples in two different conditions (affected versus normal) from 10 donors. Samples from different donors are in different colors. Hierarchical clustering was performed to separately display the expression patterns of up-regulated and down-regulated genes of ASCs from the lymphedema group versus the normal group; (C) RT-qPCR validation of 50 selected DEGs in ASCs samples from 5 donors. Samples from different donors are in different colors. The solid line represents a fitted linear regression model between log2-FCs determined via qPCR and RNA-seq. Pearson’s correlation coefficient (r), correlation test P value and adjusted R squared for the linear model are displayed in the plot. DEGs, differentially expressed genes; ASCs, adipose-derived mesenchymal stem cells; RT-qPCR, quantitative reverse transcriptase-PCR; FC, fold change.

