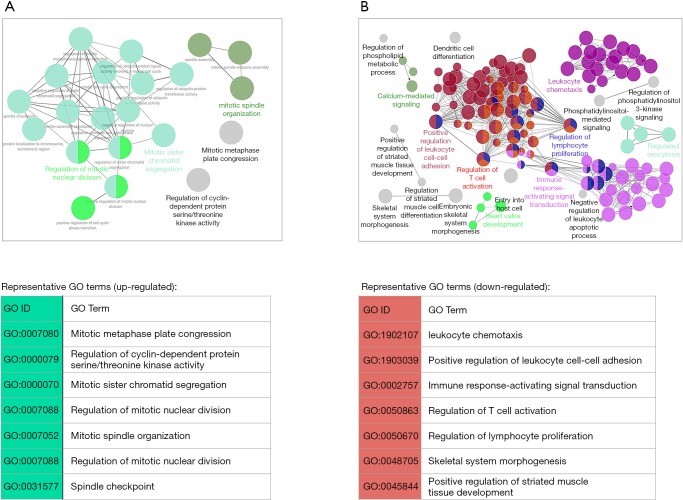
Figure 4.
Network view of the GO terms enriched in the up-regulated (A) and down-regulated (B) DEGs. The cutoff of GO enrichment analysis was set to an adjusted p value of 0.05. Each node denotes an over-represented term, and the node size reflects the statistical significance of the term. Functionally similar terms were clustered together and in the same color. The nodes in gray represent unclustered terms. Only the representative (the most significant) term within a cluster is labeled with the name. DEGs, differentially expressed genes; GO, gene ontology.

