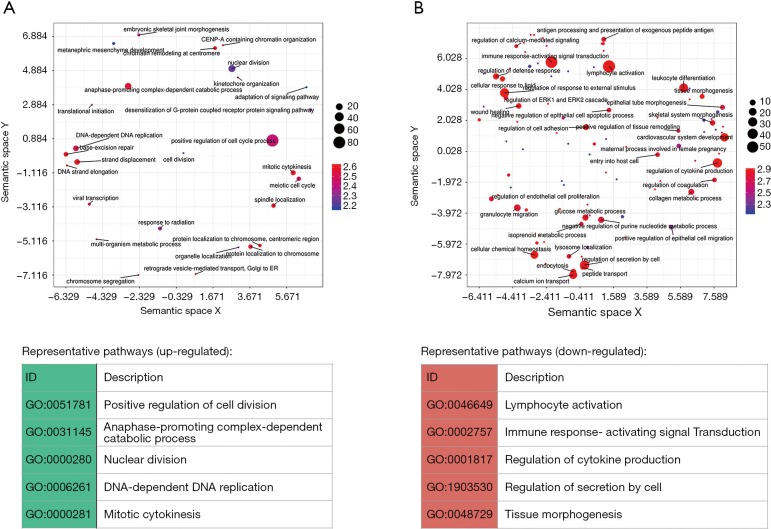
Figure 5.
Differentially expressed [(A) up-regulated; (B) down-regulated] pathways as revealed by GSEA. REVIGO was used to summarize significant GO terms by removing redundant terms and visualize terms in a semantic space. Only one representative term is displayed and labeled with its name for a group of redundant terms. The dot size reflects the number of terms represented, and the color denotes the significance of the term (–log10 q value). The distance between terms reflects their semantical similarity. GSEA, gene set enrichment analysis; GO, gene ontology.

