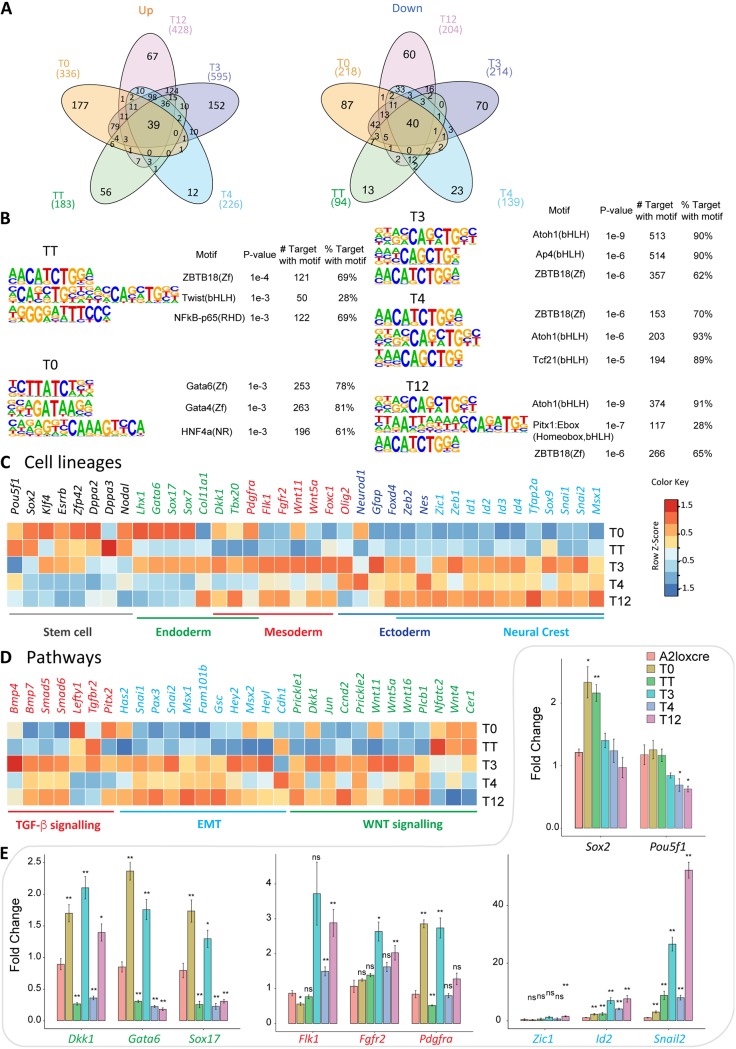
FIG 5.
Differential specificity analysis of TWIST1 dimers and monomer. (A) Pairwise differential gene expression analysis of the dimer- and monomer-expressing ESCs against the parental A2LoxCre ESCs performed with DESeq2 (61) (adjp < 0.05, fold change 2). The number of individual and common upregulated (Up) and downregulated (Down) genes are shown in Venn diagrams. (B) Top three predicted binding motifs enriched in the regulatory sequences (TSS ± 2 kb) of the differentially regulated target genes of TWIST1 dimers generated with HOMER (64). Names of the known motif and percentages of targets containing these motifs are listed. (C and D) Heat maps showing the relative expression (log2 fold versus A2LC) of selected genes involved in cell lineage, EMT, or cell signaling pathways for the dimer- and monomer-expressing EBs. Color-coded normalized Z-scores are shown. (E) RT-qPCR analysis of the expression of key lineage markers in different EBs. Expression was normalized against the value for the TBP gene and the wild-type sample at day 3 of differentiation. Each data point represents the mean ± standard error from n = 3 independent experiments. Data were analyzed by the nonparametric Mann-Whitney U test (two tailed). *, P ≤ 0.05; **, P ≤ 0.01; ns, nonsignificant. Black, pluripotency markers; green, endoderm markers; red, mesoderm markers; blue, neural crest markers.

