FIG 2.
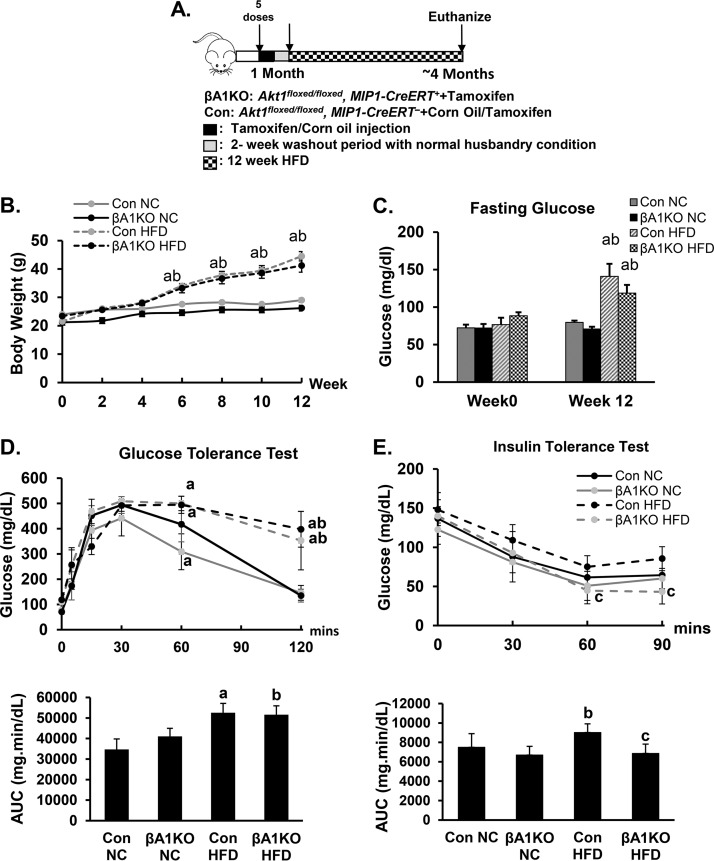
Metabolic status of control and βA1KO mice during HFD feeding. (A) Illustration demonstrating the protocol of the HFD feeding experiment. (B) Body weight of mice in different groups (n = 5 to 14 animals per group). (C) Fasting glucose level of control (Con) and βA1KO mice before and after HFD feeding (n = 14 and 9 for control NC and control HFD, respectively; n = 5 for both βA1KO NC and βA1KO HFD). (D, top) Glucose tolerance test (ipGTT) (n = 14 and 9 for control NC and control HFD, respectively; n = 5 for both βA1KO NC and βA1KO HFD). (Bottom) Area under the curve (AUC) analysis for the ipGTT curve. (E, top) Insulin tolerance test (ipITT) (n = 9 and 10 for control NC and control HFD, respectively; n = 4 and 5 for βA1KO NC and βA1KO HFD, respectively). (Bottom) AUC analysis for ipITT curve. For statistical analysis, letters indicate the following: a, control HFD is significantly different from control NC, P ≤ 0.05; b, βA1KO HFD is significantly different from βA1KO NC, P ≤ 0.05; c, βA1KO HFD is significantly different from Con HFD.

